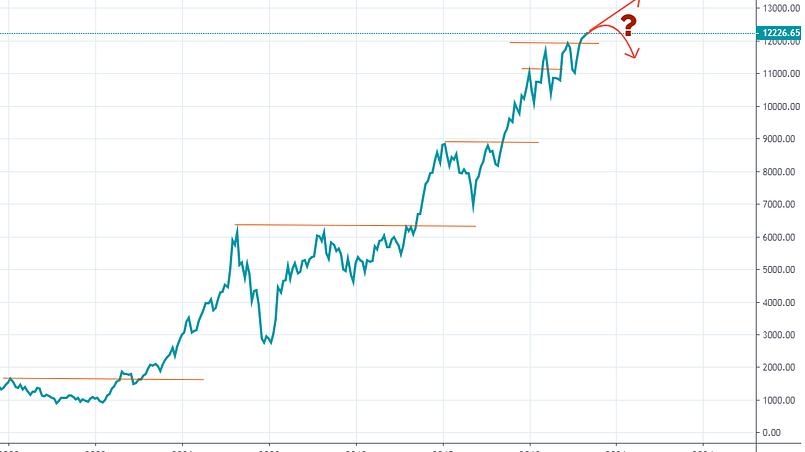
Last week we saw what happens when the markets close above the all-time closing highs. We saw that the probability of the markets to move higher after closing at all-time closing highs is very high.
Today, we will test how this behavior holds up when applied to a portfolio of stocks.
We will test a simple trend following system on monthly time frame using all-time monthly closing highs
I will only use non-compounded returns as sometimes CAGR can give you false impressions about the trading system.
Rules:
- Starting Equity: Rs. 10,00,000.
- Test period from 31/12/2006 to 31/12/2019.
- Universe: NSE 500 stocks.
- Nifty 50 must be above its 10 Month MA. If not, no new entries are allowed.
- On the last day of the month, if the close is greater than the previous highest close, Buy on the next day open.
- Exit on the next open if the stock closes below 10 Month Simple Moving Average. 10 Month MA is the monthly equivalent of 200 DMA on the daily time frame. I have already written an article about the importance of 200 DMA. Mebane Faber of Cambria Investment has written an excellent paper on 10 Month MA. 10 Month MA will act as a dynamic stop loss to our positions.
- Maximum 20 positions allowed at 5% each. Rank each position in terms of its 12 Month ROC. There are going to be times when you will have more signals than the available capital. This rule will ensure that we only buy the top 20. This rule also adds a little relative momentum flavor.
- Brokerage & slippage of 0.20% considered. If even though you may have a Zero Brokerage account, Statutory charges like STT, GST, etc. still costs us around 0.13% of the transaction value.
Let’s take a trade example…
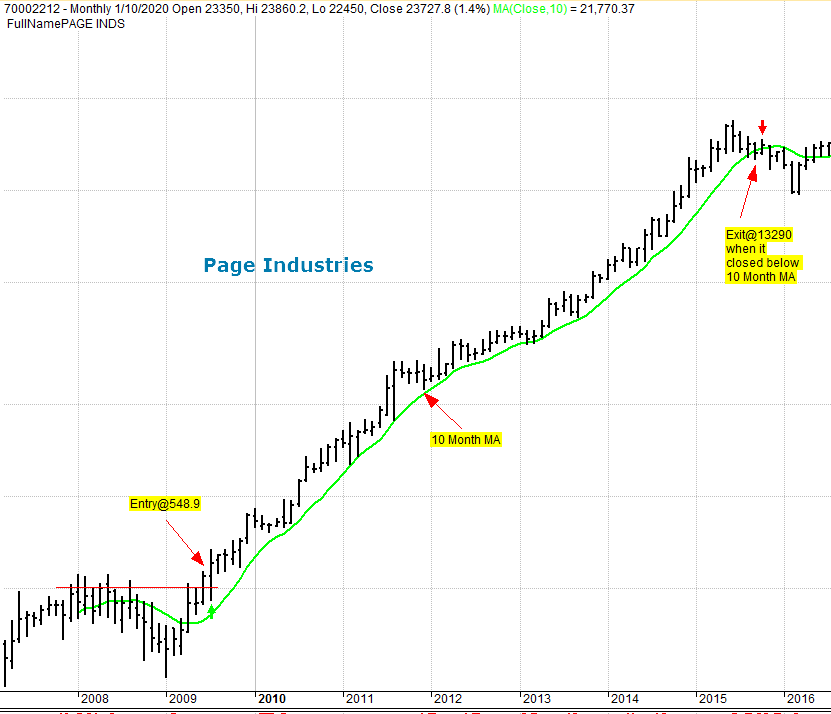
Once the stock closed above the previous highest close, we enter and exit on a close below 10 Month MA. Page Industries multiplied 23x from 549 to 13290. Of course, this one is the most profitable trade & we wish to get many of them but the reality is that these kinds of trends are far & few.
The idea is that any trend starts with some kind of a breakout and all-time closing high is the biggest form of a breakout. If you pick any stock which has created tremendous wealth, it must have, at some point in time broken out above the previous highest close.
All-time high breakout is a classic Dow Theory breakout…
- Any close above the previous peak is considered to be the start of a new trend.
- The monthly closing breakout above the previous highest close shows us the Primary Bullish Trend of the stock.
- As Charles Dow has suggested over 100 years ago that a trend must be assumed to continue until proven otherwise.
- Only closing prices are used as suggested by Dow Theory.
Let’s check out the results…
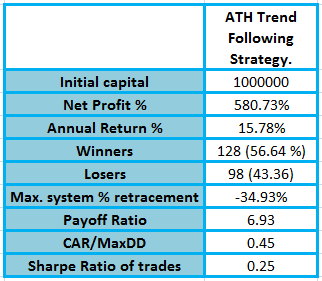
As you can see from the above table, buying stocks above all-time closing highs has been quite profitable with non-compounded returns of close to 16%. The maximum drawdown is capped at -34.93% while Nifty suffered a drawdown of close to 60% in 2008-09. Average gains are 6.93 times bigger than average loss.
Should you trade the above system? Probably Yes. Will you make similar returns? Probably Not. Why? The biggest limitation of the above test is survivorship bias. I have only considered the stocks which are currently part of the NSE 500. The objective of the test was to see the general behavior of stocks after closing above the previous highest close.
So, next time you see a stock making an all-time high, don’t fear as it could probably be the start of a much bigger bullish trend. Or it will give you a list of the strongest stocks from which you can filter out top stocks based on fundamental factors.
Some excellent research on ATH…
- Does Trend following work on stocks?
- Is buying stocks at an all-time high a good idea?
- Buying Global Stocks at all-time highs is the same as the above article but it is more detailed.
*** Actual results may significantly vary from historical results. Past performance may or may not be sustained in the future. Brokerage rate of 0.13% considered in backtests. Survivorship bias exists. This is not investment advice and is only for illustration, information & educational purposes. Please read Disclaimer before making any purchase.


