September month is over and the month of October has already started of on strong note!
So what’s in store for the markets over the next few months?
What are the long term charts suggesting?
We get so much caught up in the day to day grind that we forget the big picture.
Big Picture Analysis helps us to see the forest for the trees so to speak! It provides us a perspective about the future course of action for the markets!
We’ll analyze monthly charts of some of the major markets around the world to establish a comprehensive view of the future trend of the markets!
Let’s jump right in!
US Markets:
First, we’ll see how the US markets are doing. Whether we like it or not, the world follows where the US goes!
NASDAQ 100:
The tech-heavy index has been the frontrunner of this entire rally from the COVID-19 related market fall in March 2020.
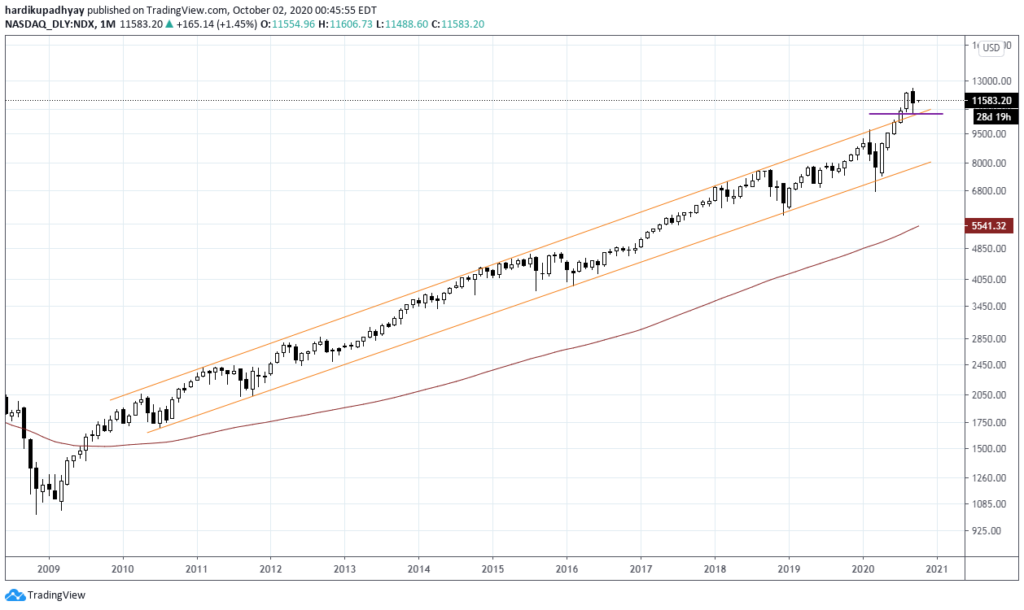
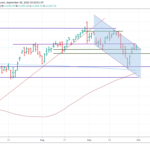
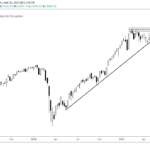
NDX has been hitting all-time highs since June this year. September saw heavy correction but took support at the rising channel and recovered some of the losses. Even though NDX recovered the losses, it has formed a Dark Cloud Cover Candlestick pattern which is a bearish reversal pattern. A break below September lows will be very much negative.
S&P 500:
S&P also followed the suit alongside Nasdaq and made a new high in September but faced the resistance at the rising upper trendline and came tumbling down to test the previous closing ATH and recovered some lost ground by the end of the month.
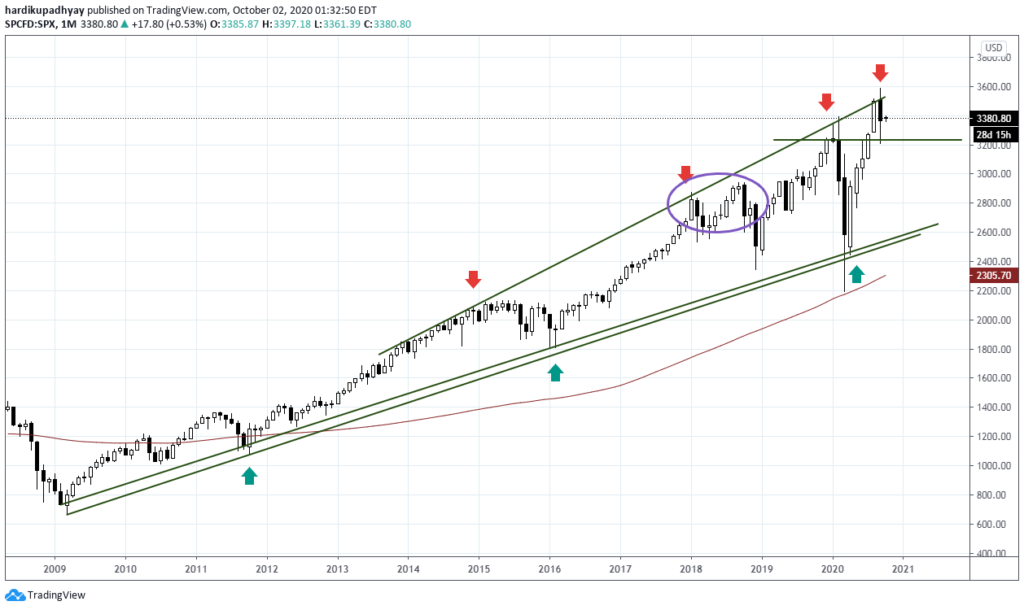
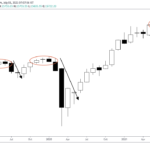
It has also formed a bearish candlestick pattern similar to NDX. As you can see the distance of the recent ATH is not very far from the previous ATH in Feb 2020. We witnessed a similar structure (Circled) between Jan 2018 and September 2018 and you can observe what followed next.
Dow Jones Industrial Average:
While the NDX & SPX have been successful in hitting ATH, ‘Papa Dow’ has not been able to.
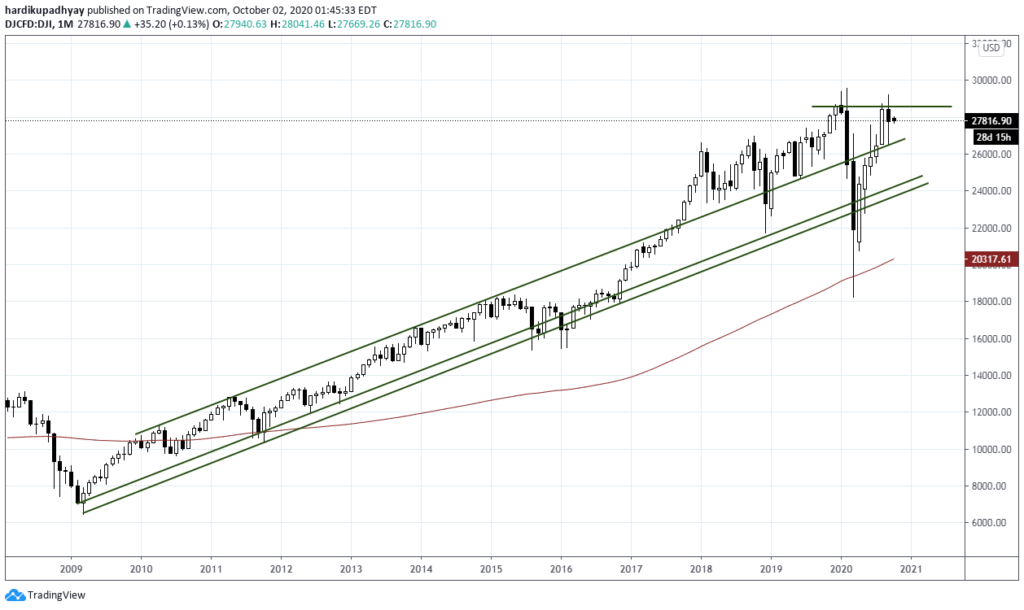
Maybe it has got to do with its composition as a price-weighted index rather than a market-cap-weighted index like the SPX & NDX. Nevertheless, its showing divergence among the US Indices which is to me is a signal to be careful.
Europe:
Let’s see how european markets are doing…
German DAX:
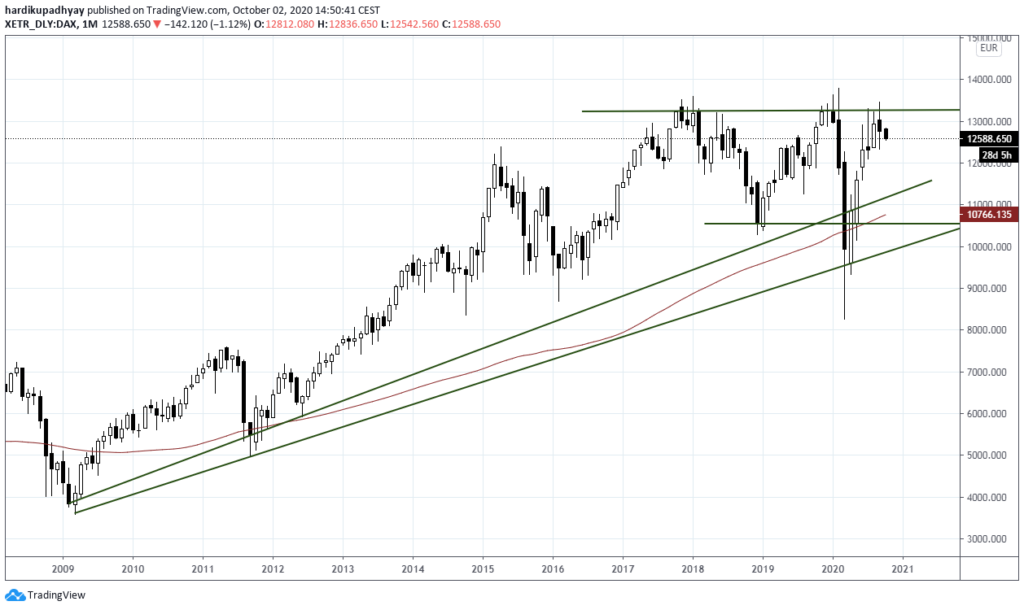
As you can see below that the German DAX has failed to break out above its all-time highs and is stuck in broad range of 13249 to 10500.
CAC 40:
The French markets are not looking in the great shape.
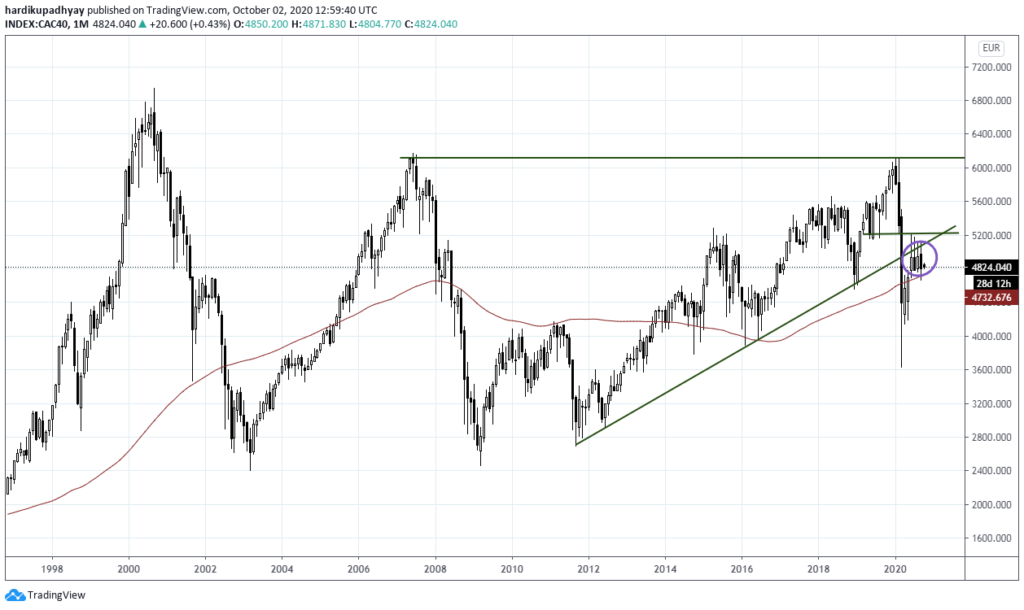
Looking at the monthly chart you can easily make out that the French markets have not been able to clear the rising trendline which to me is not a bullish sign. Unless it’s able to cross 5200, the trend is still down.
UK 100:
The FTSE 100 doesn’t look that great either!
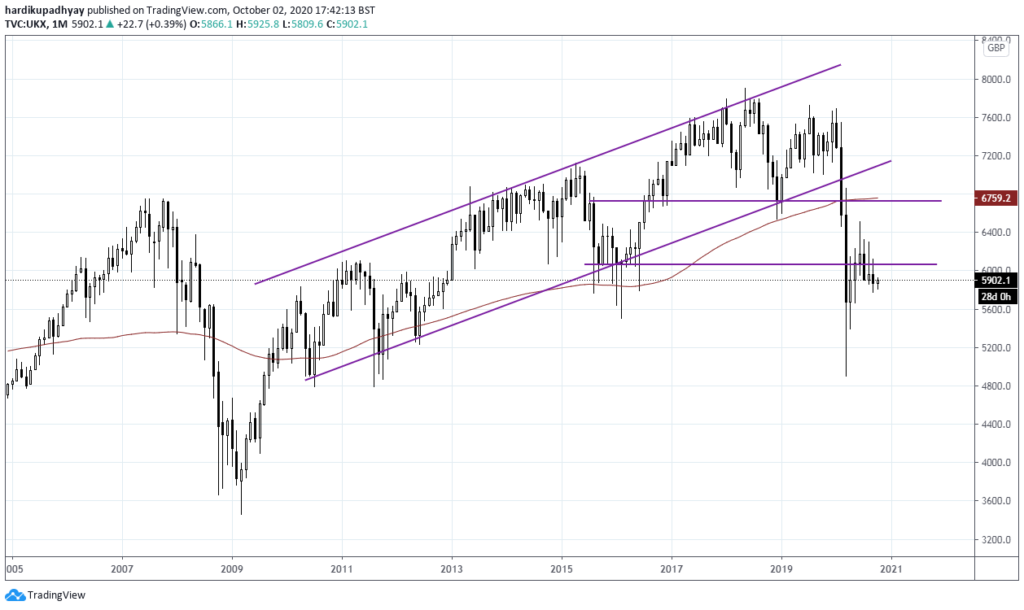
The UK has barely recovered and a retest of the March lows is possible!
Asian markets:
Nikkei 225:
The Japanese Nikkei 225 has also faced strong resistance at all-time highs near 24150. Looks like it’s not going to break out anytime soon but if it does, it will be a significant one.
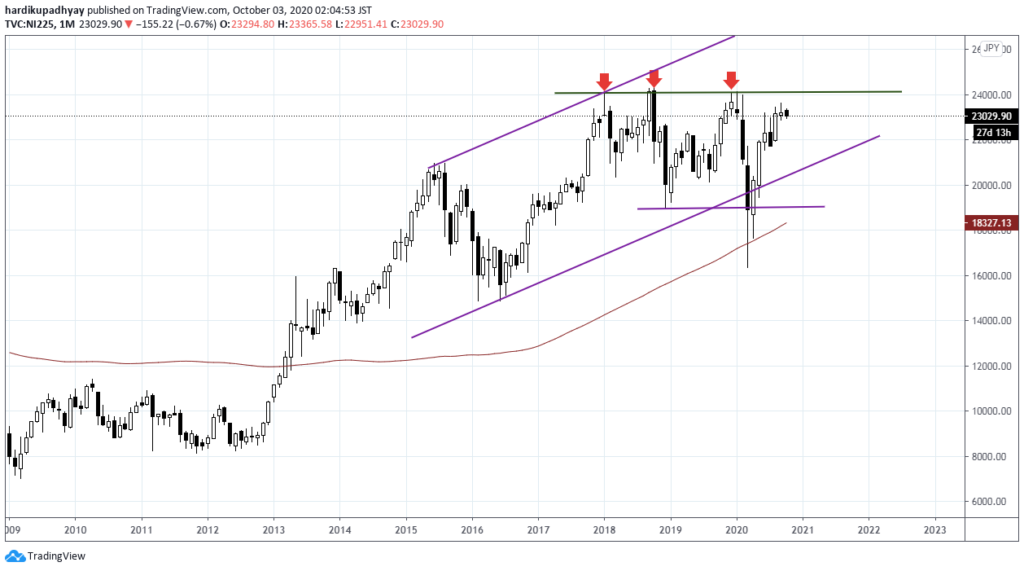
Hang Seng:
Hang Seng Index of Hong Kong is also not showing any bullish signs. The only silver lining is that its near very strong trendline support at around 23000. If it’s able to hold on to the trendline and reverses, then only we can expect a good rally.
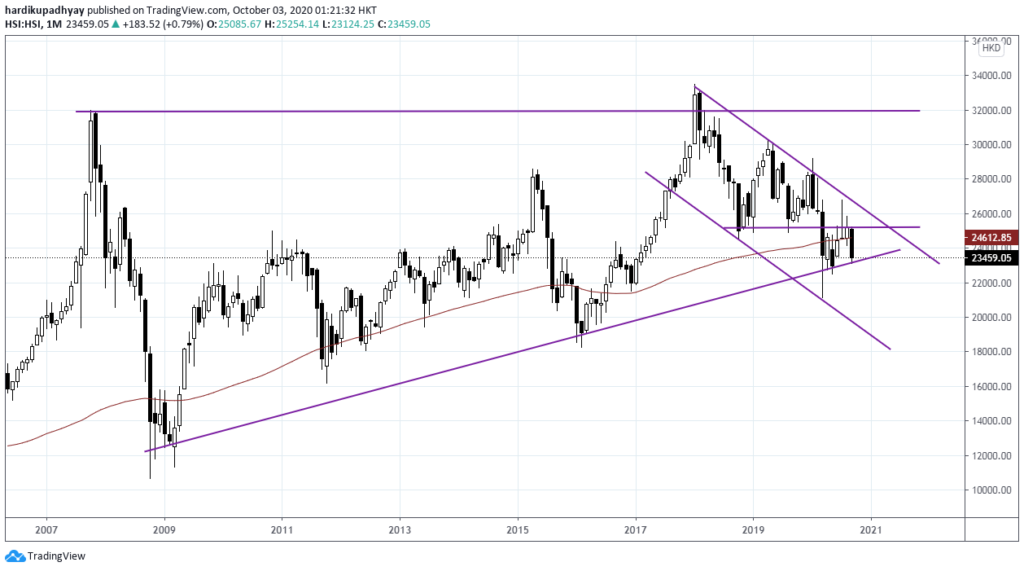
Shanghai Composite:
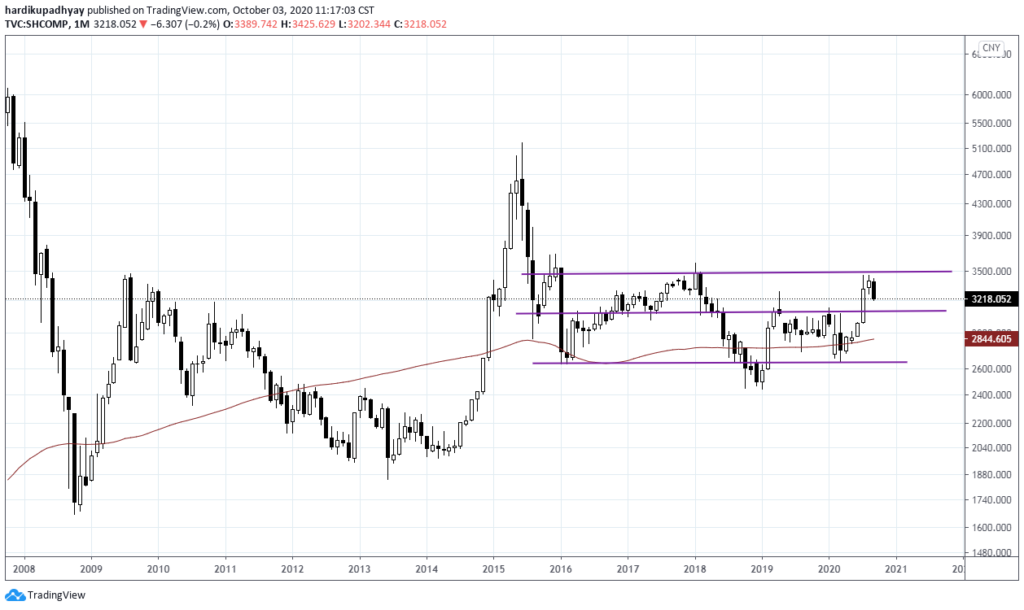
China is where the Covid-19 crisis started and spread across the world. Most economies are still fighting the Pandemic and their economic growth has tumbled to multi-decade lows. But the Chinese markets have kind of stabilized. Currently stuck in a broad range of 2500-3500, if it manages to break out above 3500, it might be looking to scale up to 2015 highs.
Nifty 50:
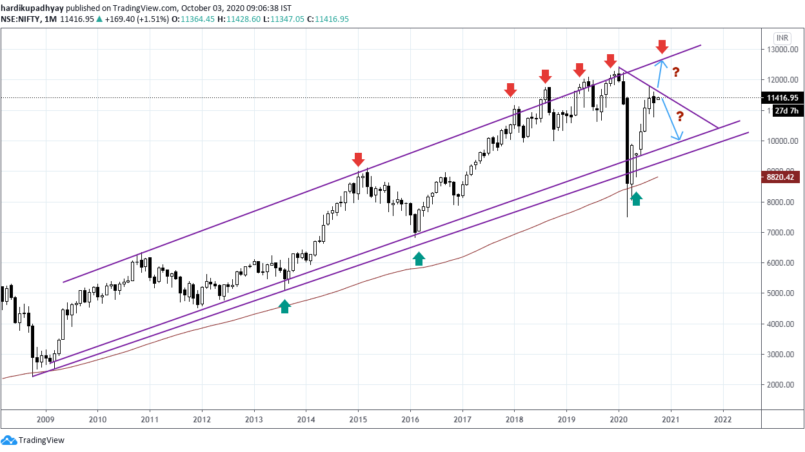
Back home, things are not looking that great at the ground level but markets have done fairly well. The economy plummeted 23.9% during the Q1 and the whole FY21 is expected to be negative while the Nifty rose around 57% from March Lows to August highs.
The Nifty has retraced almost 87% of the fall since the all-time highs in January 2020 and has hit a bump at these levels.
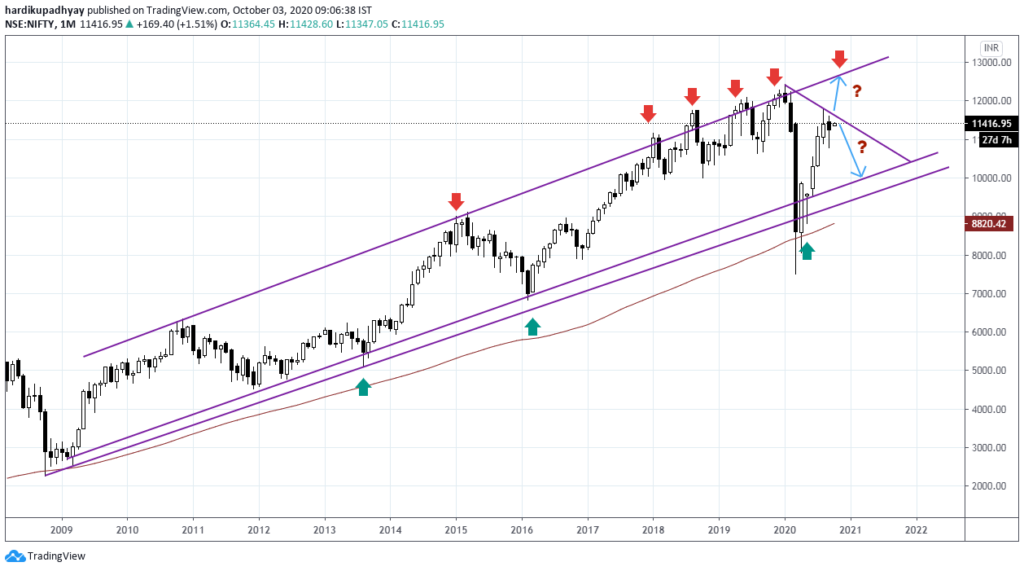
As you can see on the Monthly charts, Nifty has largely been contained into the rising channel since the lows of GFC in 2008. It has traced out a lower swing high in September which is the sign of a trouble going ahead.
Worst case, we might tumble down to around 10000 where there are March & October 2018 lows and the rising trendline support.
The most optimistic scenario is we breakout above the August highs, we might probably hit a new ATH around 12600 or so. Let’s see how it play out going ahead!
Currencies:
Dollar Index:
This one here can make or break the markets around the world. Last Month the Dollar Index rose 1.89% which made the commodities and global markets plummet.
The Dollar has been under pressure since the massive stimulus programme announced by the FED on the back of COVID-19 crisis. The Dollar Index has declined by over 10% to 91.746 from the March 2020 highs of 102 which helped the Global markets to stage a wonderful comeback.
Dollar weakness is also one of the reasons for Gold to stage a massive rally this year.
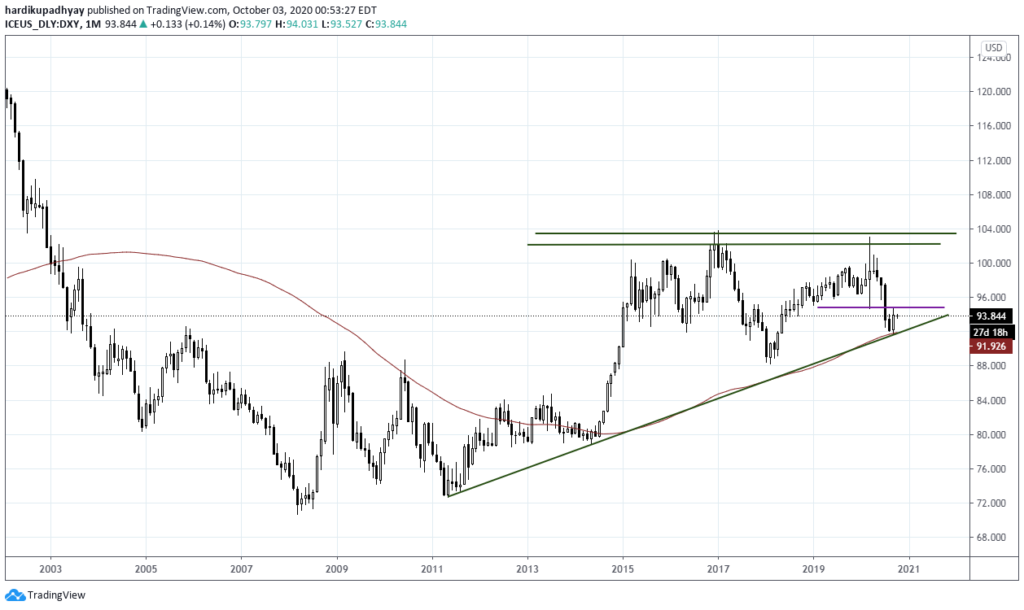
Now, the markets were expecting another round of stimulus but that has not materialized which made the Dollar to strengthen in September.
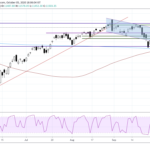
Technically, you can observe that the DXY has taken support at a rising trendline and its 100-period average. So going below these levels is extremely unlikely. If DXY is able to rise above September highs, we are looking for more trouble going ahead. So keep a close eye on this one.
EUR/USD:
The next logical pair to look at after the Dollar Index is EURO as it constitutes around 57% of the DXY which makes it an extremely important currency.
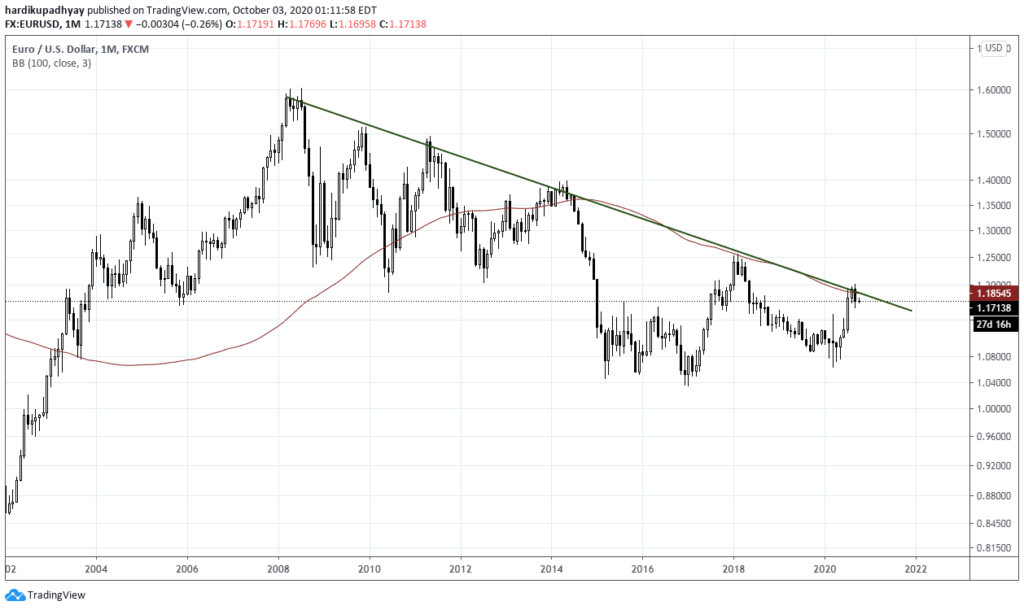
As you can see that it’s exactly the mirror image of the Dollar Index we saw in the previous chart. Both are at inflection points and break in any of the above will determine the future trend for the markets.
The most desirable outcome would be to EURO to strengthen against the Dollar which means that it must break out above the downsloping trendline which it has failed to do on numerous occasions previously.
USD/INR:
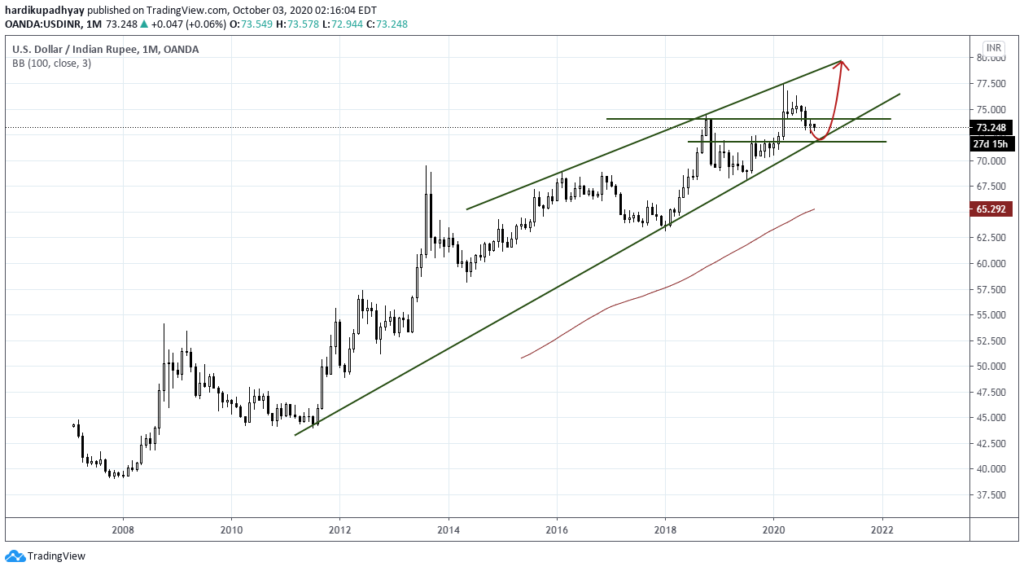
Looking at the chart, we can easily make out that the Indian Rupee is not going to strengthen very much against the Dollar anytime soon which generally does not bode well for the Indian markets.
Commodities:
Gold:
Gold has had a spectacular run in 2019 and 2020 due to a weakening dollar and uncertainty regarding the economic growth upended by the COVId-19 crisis.
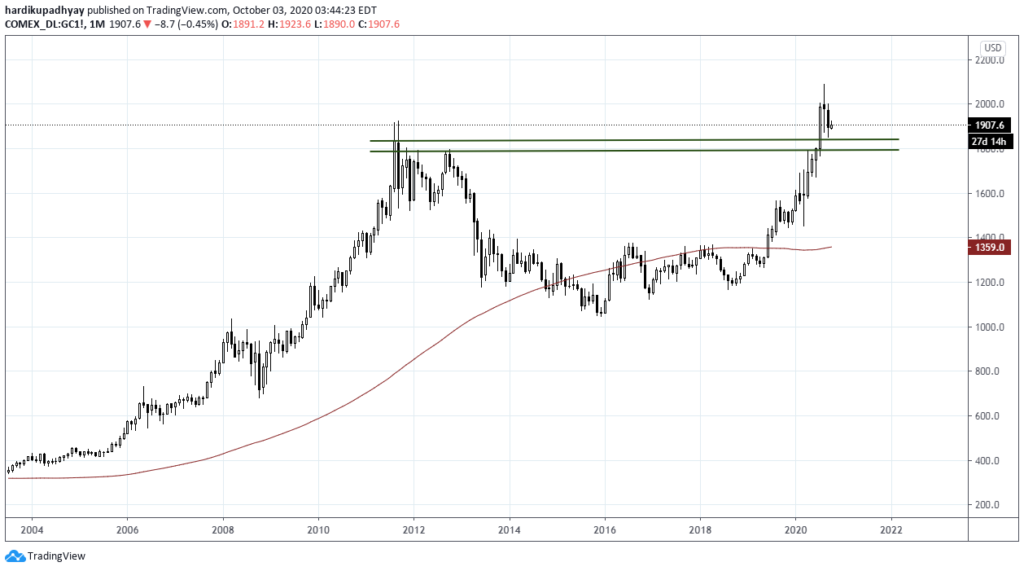
Gold is in a strong uptrend and has broken out above the previous ATH after a gap of almost 9 years. It looks like it’s testing the previous highs around the 1835-1790 zone. The break below these levels will be hugely negative as it would turn out to be a false breakout which is unlikely.
WTI Crude:
Crude has had a disaster year and we saw the negative price that was never thought to be possible. A weak global economy and strength in the dollar are pushing the crude prices down.
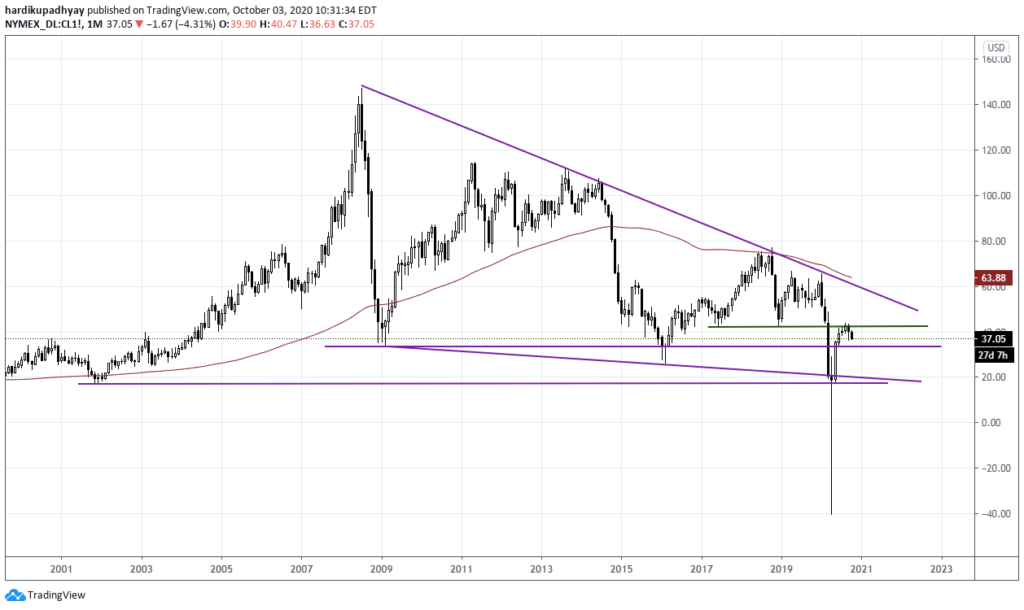
Crude is poised to fall again up to 33.75 and below that it can fall the way up to 25-18.
Conclusion:
We have seen monthly charts of the major global indices, currencies, and commodities to understand the broader picture. Here are my observations.
- None of the equity indices are hitting new highs except for SPX & NDX. In Fact, the Dow Jones Industrial Average has not been able to follow the suit and hit a fresh high. That shows that the rally is highly polarised and concentrated on only a few sectors of the economy.
- The strength in the US Dollar could be very bad for the markets as another stimulus hopes have vanished. The Dollar Index is at a crucial level which can reverse the trend in equities and commodities.
- All the major indices have seen some form of reversal in the month of September which shows that the correction is around the corner.
- The elections are approaching in the US which will keep the markets on toes as to who will occupy the oval office. To make things worse, Trump and the first lady have been diagnosed with coronavirus which will have a negative impact on their campaigning.
- Gold, although corrected recently, is poised to continue the uptrend as most of the economies are still struggling with the COVID-19 crisis, upcoming US elections, Brexit, etc.
- Back home, most of the country is now open despite the rising coronavirus cases. Ther’s a disconnect between Mainstreet and the Dalal street which has made even the RBI governer worrying.
Markets are discounting mechanisms and they have already discounted the negative impact of the COVID-19 crisis but at the same time have also discounted all the positives over the next few quarters. Now the question is what will market discount going forward which will make them rise further? I have no idea.
Looking at the analysis you might observe that I have a bearish bias. Well, I am not here to profess doom and gloom. But I think the broader perspective is necessary. It keeps you grounded and keeps a check on unwarranted optimism.
Keeping the Big Picture in mind, I have already raised cash in my momentum portfolios. If the markets fall, the drawdowns will be less and if the markets shoot off, I can always get back in!
Have a great October!


Very insightful.
Thanka for the aerial tour of the world markets.
Thanks, Pravin.