Investors have a fascination for buying low & selling high…
Even though the results are overwhelmingly in favor of buying high & selling higher…
I have repeatedly shown that buying low and selling high is a loser’s game!
Check out my articles if you haven’t done it already!
Now, as if buying low was not enough, we like averaging down even more.
It reduces our cost basis and we can buy more quantities of the stock at lower prices, right?
But it is only lucrative if the stock you averaged down goes up eventually above your cost.
But what if it keeps going down?
Now, your strategy of averaging down becomes “spiraling” down!
Don’t believe me?
How about hearing straight from the horse’s mouth?
Nithin Kamath, the CEO of India’s largest broking firm, Zerodha published an interesting study that goes on to show why averaging down can be hazardous to your financial health…
Lessons from trading on Yes Bank – Z-Connect by Zerodha***
Below are some interesting stats from the study…
1. Out of 7 lakh customers that hold Demat account with Zerodha, roughly 2 lakh customers hold YES BANK.
WTF?
That’s almost 30 % of the total customers Zerodha had at that time !!!
That number is just of Zerodha!
Can you imagine how many investors are stuck in this stock overall across the market?
Scary Movie !!!
2. These investors are sitting on unrealized losses of 59% in YES BANK,
That was up to 22/08/2019.
Since then YES BANK is down 50% and made a low Rs. 5.65. Currently trading around Rs. 18.
Say NO to “YES” 😉
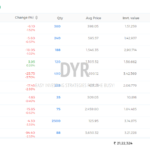
3. The last & the most interesting stat is that the majority of investors averaged these stocks as they fell further down.
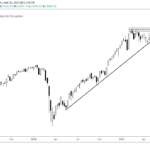
The below image from the report sums up everything…
As you can see, as the price of YES BANK(Blue) declined, the number of clients(Red) holding the stock increased.
The report states that investors averaged at four different times.
Nithin Kamath hit the nail on its head!
The cheap gets cheaper!
Still not convinced?
Let’s try to see what history has to offer?
A few weeks back I wrote the following article where I showed whether traditional RSI 14 works or not.
RSI Indicator: How to use the RSI correctively & effectively?
I ran a test between 31/12/2006 to 02/06/2020 on NSE 500 stocks. Below were the backtested results…
The rules were simple…
1. Buy the 10 most oversold stocks whose 14, 7, 4, 2 periods RSI is less than 30.
2. Exit when the RSI crosses above 70.
Now, we’ll add one more rule to test whether averaging down helps us or not!
3. Buy the stock in 3 equal parts if the RSI is below 30 and the price is below the initial entry price.
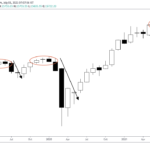
Check out the below chart to better understand the rule…
The green arrow shows the entries while red arrows show RSI below 30. So instead of buying full quantity on the first day when RSI goes below 30, we will buy only 1/3. We’ll average down further if the stock closes below our previous entry price and the RSI is still below 30.
Clear on the rules?
Alright, let’s see how they fare…
Well, averaging down further reduces the results for the RSI 14. CAGR drops from 3.76% to -0.89% although average profit and % winners increase from 3.16% to 4.02% and winners from 66.67% to 69.26%.
The winner is clearly RSI2 although CAGR drops from 13.66% to just about 4.56%, average gain, which is the edge of the system, goes up to 1.22% from 0.38%. Winners too increase from 66.91% to 76.38%.
So one thing is clear from the above test…
It’s better to be averaging in the short-term rather than the long term.
How about pyramiding?
How about averaging up the most overbought stocks based on the RSI?
I had also backtested how buying most overbought stocks perform based on RSI and below were the test results…
Buying the most overbought stocks handily outperformed buying oversold stocks based on RSI 14. At the same time buying the most overbought stocks based on RSI2 underperformed buying the most oversold stocks.
Both mean reversion & momentum is at play here but on different time frames. Momentum works better with RSI14 and Mean reversion works better with shorter period RSI2.
Let’s see how pyramiding the most overbought stocks work…
The rules are exactly the opposite…
1. Buy the top 10 most overbought stocks whose 14, 7, 4, 2 periods RSI is greater than 70.
2. Exit when the RSI crosses below 30.
3. Buy the stock in 3 equal parts if the RSI is above 70 and the price is higher than the initial entry price.
Pretty simple!
Pyramiding higher performs even better…
Averaging up the most overbought stocks based on RSI 14 improves the returns from 21.25% 24.45%.
Well, the verdict is out!
Buying lower is bad but averaging lower is even worse!
Some important pointers:
- The great irony is that the RSI14 is a momentum indicator inherently but used as a mean reversion indicator! I use a variation of the RSI in my long term momentum strategy to identify the strongest stocks!
- The stocks are mean-reverting in the short term but trending in the longer term.
- Averaging down can work in the short term! Averaging up can improve returns if you’re trading for the long term.
- Being right does not equal being profitable. Most investors like to be right on their trade and that’s why buying low makes sense to them because your winning % is more. But investors almost neglect the fact that buying low has a smaller average gain and one big loser like the YES BANK can wipe out all of your gains or even capital!
- Similarly buying high feels risky as you only win about 35–45% of the time but one big winner can turn you into profits! Just look at Rakesh Jhunjhunwala’s portfolio. How many stocks do you think has made him the most amount of money. Just a few! The biggest gainer is of course Titan Company.
All the best!!!
P.S:
Just a gentle reminder that the registration for the Momentum Investing Masterclass closes on 15/01/2021. Register Now!
*** Survivorship bias exists. No brokerage included in the tests. Past performance is no guarantee of future returns! This is not investment advice & it is only for educational purposes.