One of the best Financial Years in the recent times has ended!
From April 1st, 2020 to March 31, 2021, Nifty has risen by close to 78% on a close to close basis.
That’s a stellar performance in the face of the worst pandemic, subsequent lockdowns, and economic recessions!
A lot of gloom & doom sayers were left wondering what the hell just happened?
One of the most important contributing factors to this superb recovery is liquidity! Central banks around the world have pumped in a huge amount of liquidity to stimulate the economies!
But even more important is the fact that markets discount ‘almost’ everything.
Extreme pessimism is generally followed by extreme optimism!
I vividly remember that in the 2008 crisis (when I was just four years old in the market), the economy was buoyant and growing at around 10%! I was left wondering as to how can markets tank big time when the market in particular and economy, in general, is doing great?
It took me some time to understand the principle that the markets are a discounting mechanism. Current prices reflect future growth expectations!
So in March 2020, when there was extreme pessimism, investors started to discount the immediate worst and the future best!
Followed by strict lockdown imposed by the government to stem the rise of the pandemic, it was anticipated that the economy would contract big time!
So when the actual news came out about the contraction in GDP by almost 25%, markets did not fall! Because it was already priced in!
It’s like Buy on rumor & sell on news!
Anyway, what is the market discounting currently?
Let’s try and understand with Monthly charts first and then we’ll go granular…
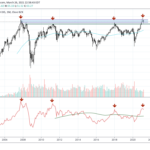
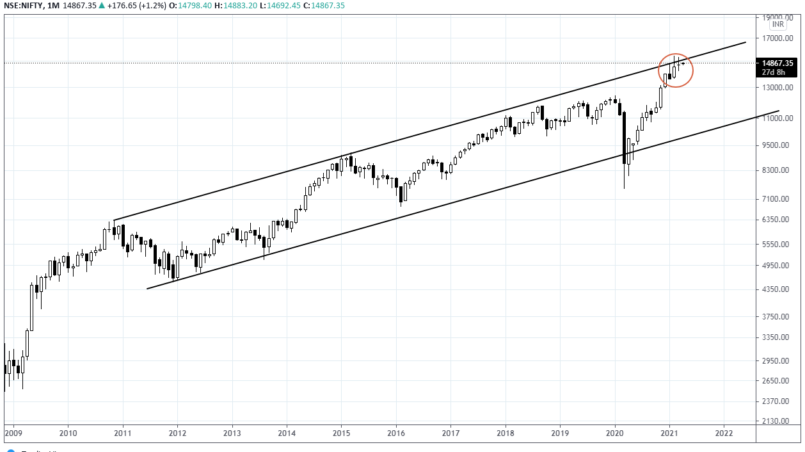
Nifty 50
As you can observe over the last 3 months, there are larger upper wicks or shadows. What that shows is that the supply at higher levels is overweighing the demand.
Last month candle was a DOJI with higher upper shadow that shows exhaustion.
These candles also coincide with trendline resistance on a Log Scale chart.
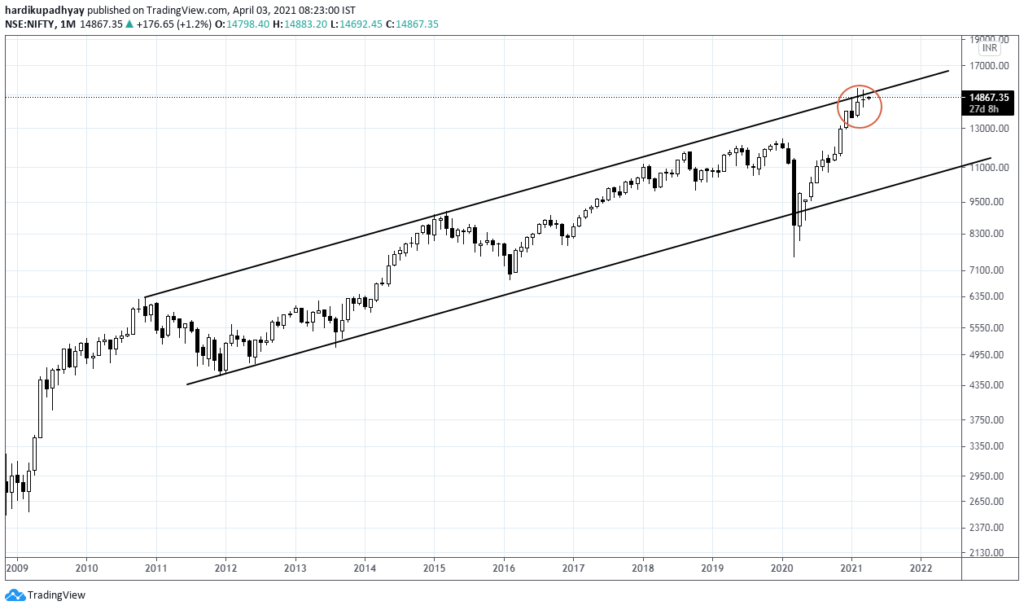
Candlestick patterns are excellent indicators of the probable reversal in the existing trend if they are found at the right place in the chart.
The above long shadow candles found near the resistance are warning signs.
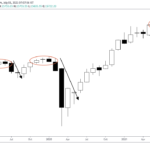
Let’s now have a look at the weekly candlestick chart of Nifty and see what’s happening there…
We can see that it has arrested the decline near the trendline & horizontal supports and staged a bounce-back around the previous week’s high. But the rally was lacking conviction and given the fact that we had only 3 days in the previous week.
But what if we looked at the line chart of Nifty?
We can clearly see that the Nifty has broken the dominant demand line and now trying to retest it. If it fails to cross the minor trendline and closes below the 14500-14433.7 zone, we are in for a lot of trouble. Nifty needs to vigorously cross the minor trendline as well as previous closing top above 15030.95 to sustain the uptrend.
Now let’s look at two sectors that contribute almost 55% in Nifty, Financials & IT. We’ll use Nifty Bank as it is the closest proxy to financials in Nifty while Nifty IT for IT.
Nifty Bank
Well, what do you see?
The above is the log scale chart of Nifty Bank. It can be seen that the Nifty Bank is at the upper end of the trend channel that shows that the upside is limited.
The same goes for Nifty IT.
Nifty IT
It’s near the upper end of the channel and already showing exhaustion.
What’s happening with broader Nifty 500?
Nifty 500
Well, no surprises here! The broader Nifty 500 is also struggling near the upper channel.
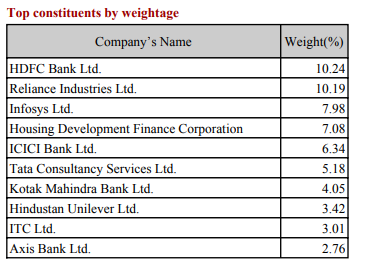
Nifty 50 top 10 stocks:
Now let’s look at top 10 components of Nifty 50 which contribute more than 60%.
HDFC BANK:
Well, India’s largest private sector bank has traveled from one extreme to other. It’s facing significant resistance in the area of 1630-1750 or thereabouts. Broadly speaking, this one is also at the top end of the trend.
Reliance:
Reliance was the torchbearer of this entire rally but for the past few months, it has gone nowhere. It’s stuck in a range between 1840-2240. It sure looks like Reliance has made a lower top although we would need a followthrough below the previous month’s low. This one’s wait n watch.
INFY:
INFY is in no mood of tiring and is firing all cylinders. This one really is the most bullish chart & it’s likely going into the new galaxy!
HDFC:
India’s largest mortgage lender looks exhausted at the upper end of the channel. Here also large upper wicks are visible. It has respected this trend channel for the last 10 years. If it can maintain above previous all-time closing highs at around 2400, it can probably test the highs at around 2900 or so.
ICICI BANK
The same picture as others. Topped out near the upper trendline. Notice how it kissed the lower trendline in March 2020 which makes this channel extremely important. If it’s able to maintain the previous ATH at 550, it can probably test the recent highs.
TCS
TCS is also peeping out of the trend channel towards a new high. As long it’s above previous peak at 2885, the trend looks intact.
KOTAK MAHINDRA BANK:
Kotak Bank also has similar chart like the HDFC Bank. As long as we’re above 1700, there’s a higher probability that we will make a new high in the coming months.
HINDUNILVR
HUL is contained in a tight channel and closed at new all-time monthly closing highs. Looks like it will slowly drift towards the upper trendline around 2700 or so.
ITC
There’s nothing here. ITC’s still in a primary down trend unless it’s able cross the recent high at 240.
AXIS BANK:
Axis Bank is grossly underperforming Nifty, Nifty Bank, HDFC BANK & ICICI BANK. Unless it’s able to cross all-time highs above 808, we have nothing here.
Conclusion:
As we saw that the major indices are trading near the upper end of their trend channels. Most of the Top 10 Individual constitutes of Nifty are trading at the upper end of the extreme.
So what does that mean?
As we learned earlier that extreme pessimism is followed by extreme optimism. All these indices and individual stocks are trading at extreme optimism. That is not to say that they can’t go up or they will fall heavily but the rally from here on could be what you call the euphoria which usually is the precursor to large corrections in the markets.
Just as an example, look at how the Adani group stocks have fared over the last year. Almost all the stocks have multiplied by 3-5 times in exactly one year. That reminds me of how Reliance & ADAG group stocks went up in 2007-2008.
While the ADAG group is almost non-existent because of excessive leverage, Reliance survived because it was a cash cow. Adani group is also highly levered just like the ADAG group. We all know what happens to excessive leverage when the tide turns. Let’s hope that doesn’t happen!
Warren Buffett quote below aptly summarises the above situation…
“Only when the tide goes out do you discover who’s been swimming naked.”
Well, markets will do what they will and we have no control over it. But we can only control our capital and how we protect it. Having some portion of your portfolio in cash at all times is not a bad idea. Remember, cash also is a position.
Have a great day!