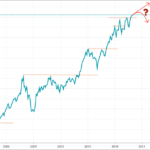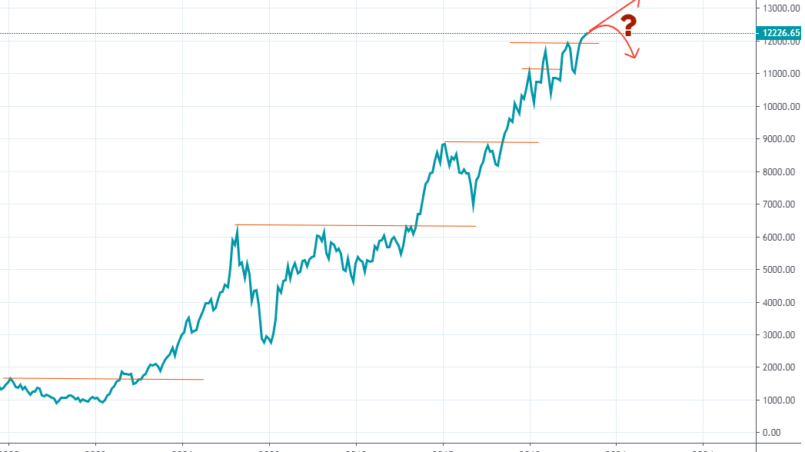
Recently, markets around the world, including Indian Markets have been hitting all-time highs.
Analysts have been saying valuations are sky-high, there is no earnings growth, GDP is at its lowest, Consumer Demand is down, Corporate Investments are low, etc and yet, markets are hitting new all-time highs.
Arvind Subramanian, former Chief Economic Advisor to the government said…
“I hope the first behavioural economics project for the Centre is going to be to explain to me why as the economy has been going down, the stock market has been going up. If you can crack this puzzle for me in the first project, I will fly down all the way from the US to understand this puzzle. Through its behavioural economic research, the centre should shed light on economic policy questions that policymakers are asking,”
When a renowned economist makes such a remark, should you be worried?
Well, Yes if you want to miss out on the rally from here!
One thing I am pretty clear in my mind that markets are supreme & beyond anyone’s control. It will find its own way & our job as a trader/investor is to listen to what market is saying and not what analysts are saying.
The following quote by John Maynard Keynes aptly describes the situation…
“Markets can remain irrational longer than you can remain solvent”
But what does the data say? Let’s find out!
We will test what happens after 1, 3, 6, 9 and 12 months when the market closes at an all-time monthly high.
Rules:
- On the last day of the month, Buy if the Sensex closes above previous ATH close.
- Exit on the last day after 1, 3, 6, 9, 12 months.
We will use Sensex as it has a longer history than Nifty. We will test it from 01/01/1980 till 31/12/2019.
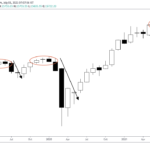
Let’s check out what happens if we buy Sensex at all-time closing high.
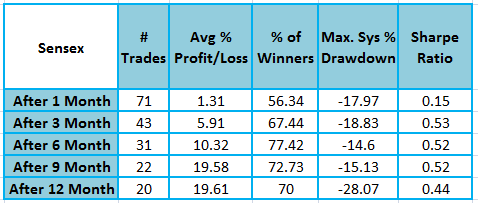
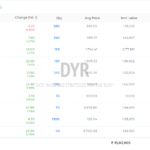
As you can see from the table above Sensex has risen more often than not after it closed above the previous highest monthly close. If you hold it beyond 6 months, average returns are greater than 10% with more than 70% probability of positive returns.
Let’s see what happens when tested on NIFTY from 01/11/1995 till 31/12/2019.
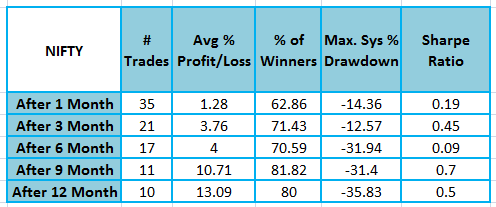
Nifty also shows similar performance as Sensex.
As you can see from the above test that after closing above the monthly, highest close, the probability of outperformance is high. Although it can be argued that the sample size is too small to infer any conclusions.
What about other markets?
Let’s see whether this behavior is confirmed in other major indices like S&P 500, NASDAQ COMP, Dow Jones, CAC, DAX, NIKKEI, FTSE 100, etc. For this test, we will only use a 12-month window after the highest monthly close.
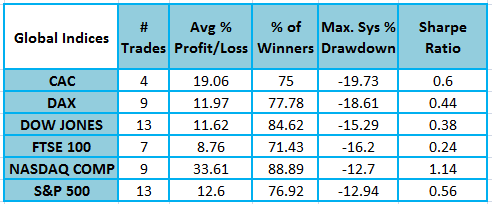
Similar performance across the major global indices. There is no trade in NIKKEI 100 as the index has not hit any fresh all-time highs since the 90s.
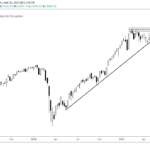
Well, you’ll agree that any new trend starts with some kind of a breakout and ATH is also a type of longer-term breakout.
Buy high & sell higher is the underlying philosophy and our DYR Dual Momentum strategy also relies on the same principle.
So as per the above stats, you can definitely say that probability favor continuation of the uptrend.
Next week we’ll see how all-time closing highs work on a portfolio of stocks.