It’s been a terrific week for the bulls!
Markets pushed through the previous intermediate highs and made a new top at 11938, just shy of the psychologically important level of 12000.
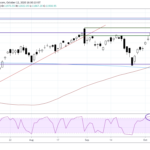
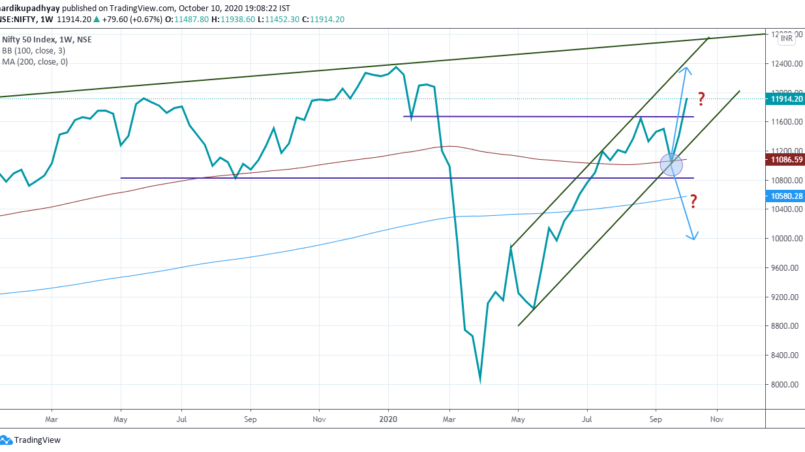
I had published the following weekly chart of Nifty in my 28/09/2020 issue of the Daily Trading Plan. What do you see?
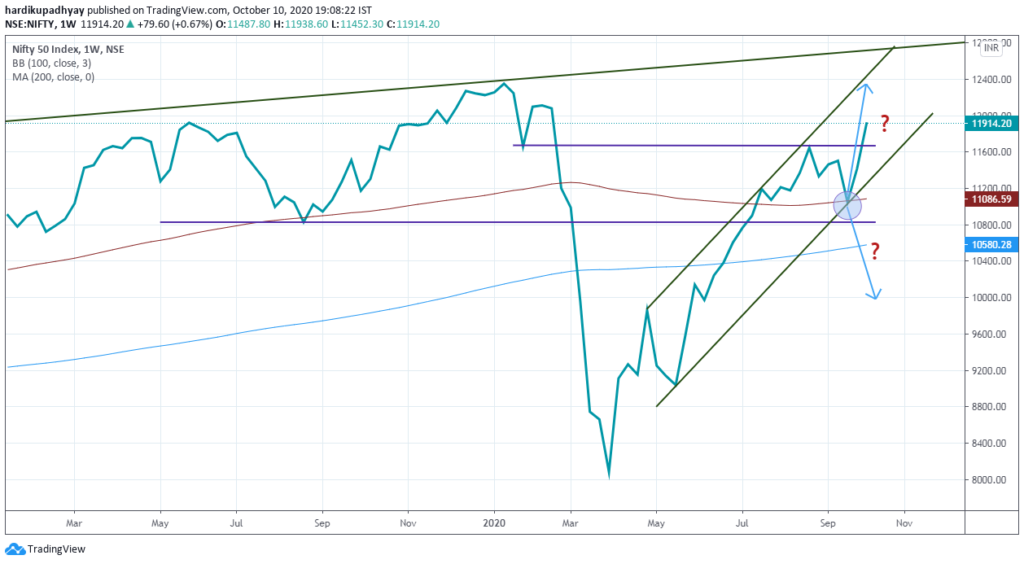
Well, one thing is very clear from the chart is that we have respected the trend channel, 100 week MA, and made a higher high.
Now, when markets are making higher highs and higher lows, does that in any way suggest a downtrend? I think not!
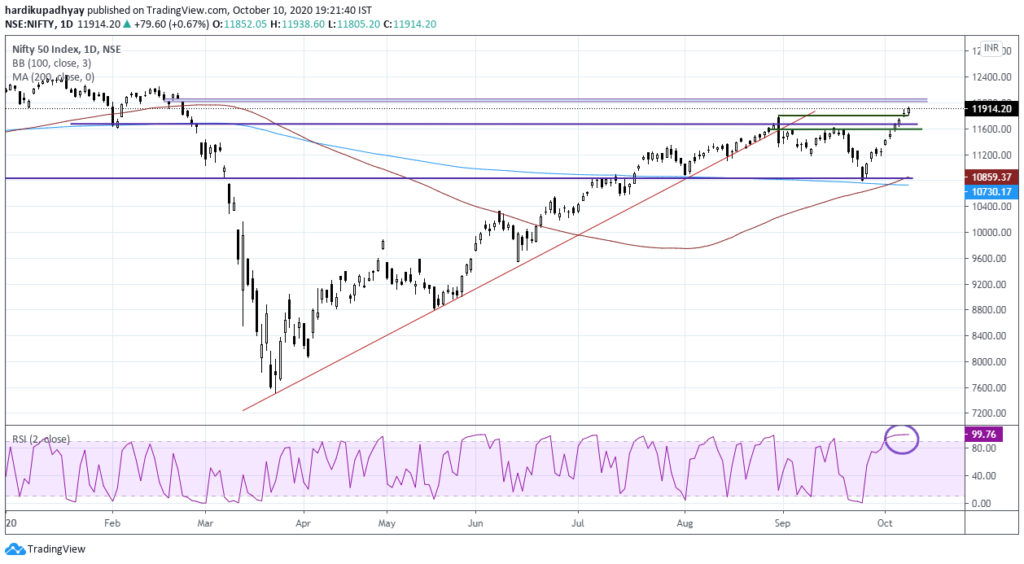
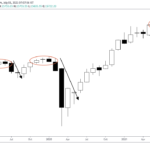
On a short-term basis, the Nifty is highly overbought and faces a significant resistance between 12012-12071 where there’s an unfilled gap!
The intermediate trend is clearly up but we may go through a short-term pause or pullback from overbought conditions!
What’s the Nifty Bank Suggesting?
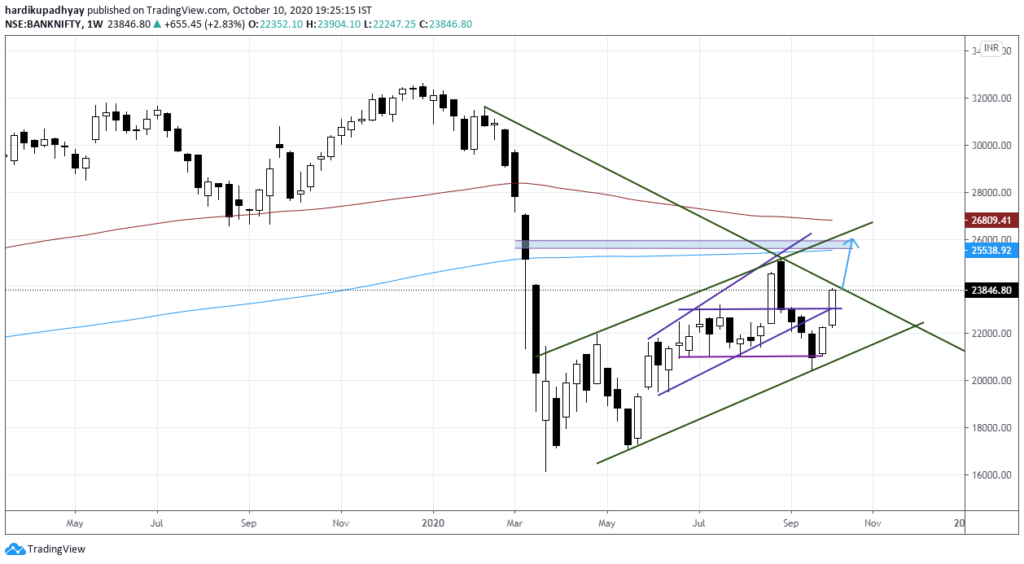
Nifty Bank has performed very well during the past two weeks!
Here are my observations on Nifty Bank…
- On a weekly chart, if the Nifty Bank succeeds to move above 24000, the rally can continue towards 26000 where there is upper trendline resistance, 200 Week MA and an unfilled gap.
- On a short-term basis, it is overbought at its 200 DMA and any pullback towards 23000 could be a buying opportunity.
The outlook remains cautiously bullish!
Have a great week ahead!
P.S:
I have already updated the performance of my portfolio yesterday. Do check it out in case you haven’t already!