This is Part 2 of the study, “Applying Mean Reversion strategies work on Indian Markets?” In this article, we will try and test the RSI2 indicator popularised by Larry Connors & tradingmarkets.com. He goes on to say that the RSI2 indicator is close to the Holy Grail of indicators.
You would want to check out Part 1 of the study if you haven’t already done so.
So what is RSI?
RSI stands for Relative Strength Index and developed by J. Welles Wilder in the 1970s. It is one of the most popular indicators among traders. Almost all charting software has this indicator inbuilt.
The most common use of RSI is to gauge overbought and oversold conditions. The default period as suggested by Wilder is 14 days. But Larry Connors, in his book, “Short term trading strategies that work”, has shown that default RSI (14) does not have any “edge”. He showed that lowering the RSI periods improved the results, especially the RSI2 indicator.
Rules of the RSI2 indicator strategy:
Following are the rules of the RSI2 indicator strategy:
- Close of the stock is above Rs.5 and average daily volume over the last 21 days greater than 500000 shares.
- The closing price of the stock must be above 200 Day Moving Average.
- Today buy on the close if RSI (2) is less than 2, 5,10,15,20.
- If today Exit is triggered, we sell the position on next day’s open :
- Exits Used: First Up close, Close greater than 3 Day Moving Average, Close Greater than 5 Day Moving Average, RSI (2) greater than 30, 50, and 70.
Let’s understand the rules in detail;
Rule 1: We are buying stocks above Rs. 5 so that we are not into penny stocks. Stock’s average volume over the last 21 days above 500000 shares shows that the stock is liquid & can be easily bought or sold.
Rule. 2: Stock which is above 200 DMA shows that the stock is in an uptrend. Remember we want to buy stocks that are into strong trends but are experiencing a price pullback.
Rule. 3: We buy stocks only when the above conditions are met & the RSI2 indicator is less than the desired threshold at the close. This rule is the key to identifying legitimate pullback. We will test different variations of the RSI2 indicator to determine its robustness.
Rule.4: This rule is self-explanatory. If any time we are in the trade and exit is triggered, we will sell our positions on the next day’s opening price. The following exits have been used to determine the results.
- First up Close: It is simply any day you are in the trade and the stock closes above the previous day’s close. For Example today our entry triggered at Rs. 20 and stock closed at 19. If tomorrow stock closes above 19 will trigger our exit signal irrespective of our purchase price. If the stock closes tomorrow at, let’s say, 19.5, our exit is triggered at loss.
- Close above 3DMA: Whenever we have an open position and the stock closes above 3 Day moving average.
- Close above 5DMA: Whenever we have an open position and the stock closes above 5 Day moving average.
- RSI (2) can also be used to exit open positions whenever it closes above 30 or 50 or 70.
Test Results:
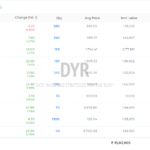
Top 10 Variations in terms of average gain per trade:
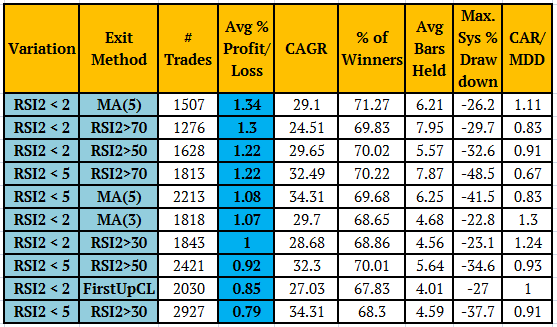
As we can see from the above table, the Average Gain per trade ranges from 0.79% to 1.34 %. This is referred to as “Statistical Edge”.
Also, all the variations win % range from 67.86% to 71.23 % which is very high. All of the variations beat B&H by a wide margin with lesser drawdowns and lower exposure.
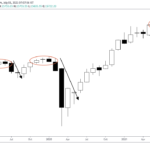
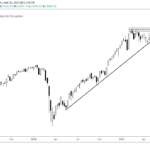
Please have a look at the equity curve of the top variation of RSI2 in terms of average gains (Red) compared to NSE 500 (Green). The variation below has been seen working in real-time with real money also. This variation far outperforms buy and hold & NSE 500.
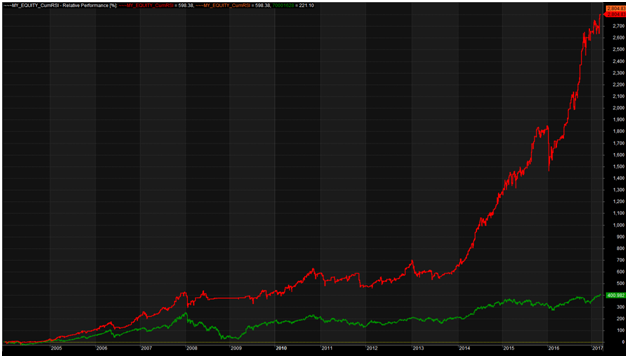
Also, we can see in the Equity Curve how we are saved by 200 DMA in the bear market of 2008-09. Since most stocks were below 200 DMA in 2008, we did not see major drawdown as there were no trades. The importance of 200 DMA will be discussed in Section 4.
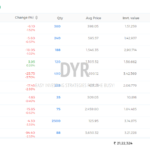
Top 10 Variations in terms of CAGR (Compounded Annual Growth Rate)
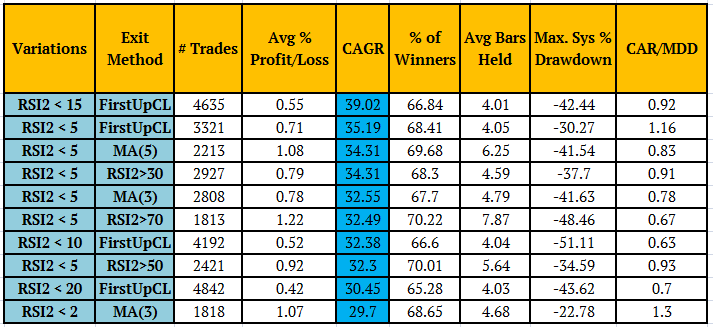
All the top variations have a CAGR in range of 29.7% to 39.02% which is extremely high although the number of trades is also higher. Now we will see the top 10 variations in terms of winning percentages.
Top 10 variations in terms of winning %
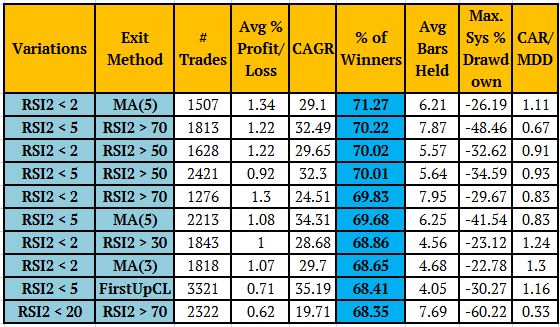
All top 10 variations show the range of winners from 68.35% to 71.27%.
This test shows that the RSI2 indicator strategy nicely identifies the mean reversion behavior on Indian stocks.
In the next part, we’ll check out the Cumulative RSI strategy & see how it performs.
P.S.
I originally tested these strategies from January 2004 up to March 2017. In future posts, we will check out its latest OUT OF SAMPLE results.