This is part 3 of the study, “Applying Mean Reversion strategies in India”. In this part, we will check out another interesting concept of Cumulative RSI introduced by Larry Connors in his book, ” Short Term Trading Strategies That Work.”
You would want to check out Part 1 and Part 2 of the study if you haven’t already done so. Let’s see how it performs.
What is Cumulative RSI?
It is simply a running total of the RSI (2) over previous ‘N’ days where ‘N’ could be 2 or 3 etc. For Example, if today’s RSI (2) is 10 and yesterdays RSI (2) is 8, then Cumulative RSI is 18. Let’s have a look at the rules of the strategy which are identical to the previous strategy.
Rules of Cumulative RSI strategy:
- Close of the stock is above Rs.5 and average daily volume over the last 21 days greater than 500000 shares.
- The closing price of the stock must be above 200 Day Moving Average.
- Today buy on the close if the total of today’s RSI (2) plus yesterday’s RSI (2) is less than 2, 5,10,15,20.
- If today Exit is triggered, we sell the position on next day’s open :
- Exits Used: First Up close, Close greater than 3 Day Moving Average, Close Greater than 5 Day Moving Average, RSI (2) greater than 30, 50, and 70.
- Maximum 5 open positions.
As the rules are the same as the RSI2 strategy except for the use of the Cumulative RSI indicator instead of RSI2 Indicator, we will not discuss them in detail here.
Test Results:
Let’s jump right into test results.
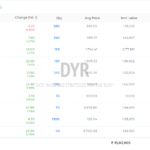
Top 10 variations in terms of Average Gain per Trade.
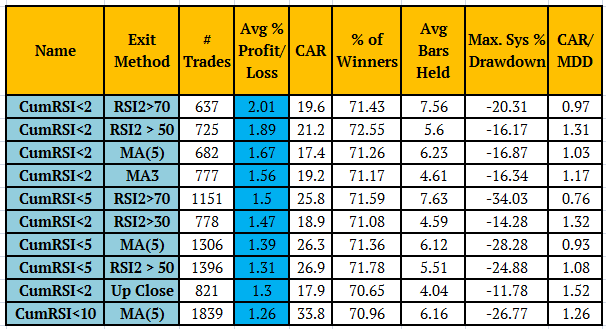
As we can see from the above table, Cumulative RSI does improve the results over a simple RSI but at the expense of a lower number of trades. It is quite obvious because the Cumulative RSI readings are cumulative in nature. These are some great edges with higher Sharpe ratios. All the variations winning percentage is more than 70% while the drawdowns have decreased.
Let’s look at top variations with the Highest CAGR.
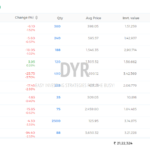
Top 10 variations in terms of CAGR.
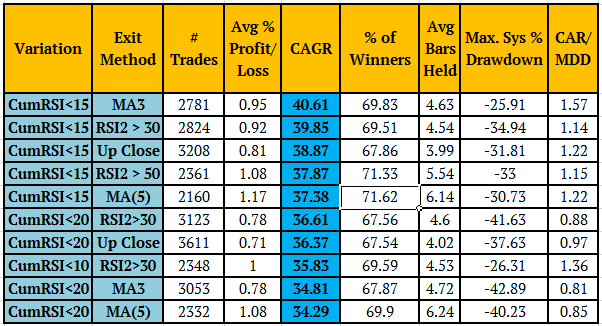
All the above variations have CAGR of more than 34% which is impressive for a simple system like this.
Now let’s turn our attention to the top variations with the highest winning percentages.
Top 10 variations in terms of highest winners.
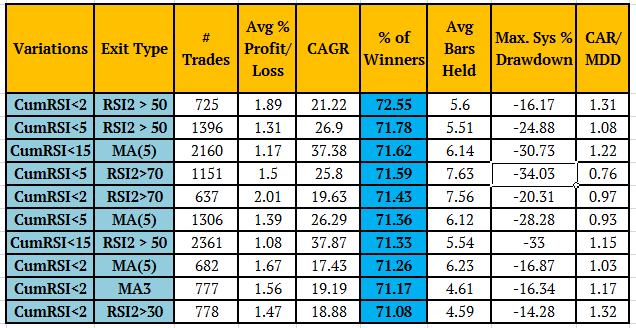
All Top 10 variations show winning % more than 71%!!!
Why do we care so much about winning percentages?
High winning percentages lead to smooth portfolio growth. If you have fewer losers then losses are less likely to accumulate which in turn helps us to follow the strategy. Also since we have higher winners, there are going to be low drawdowns and there will be less violent swings. The above test results do show that both the above strategies have win ratios higher than 67%.
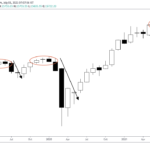
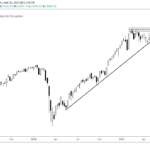
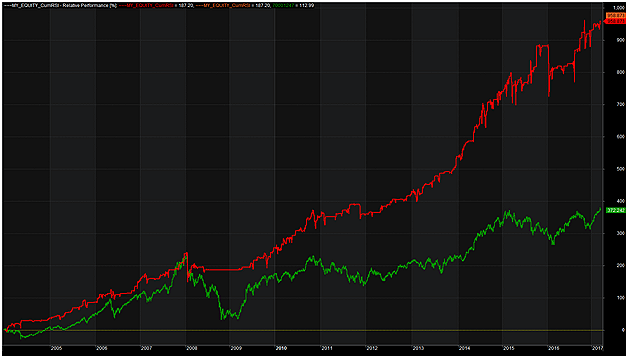
Below is the equity line for Best Performing CumRSI variation (Red) in terms of the highest average gain per trade compared to NIFTY (Green). You can see it outperforms Nifty by a wide margin and equity growth is smoother.
As we have seen in this post, CumulativeRSI does a fine job of identifying legitimate pullbacks. It is simple to calculate but effective at pinpointing mean reversion behavior in stocks.
Next, we will look at the importance of 200 Day Moving Average & how to use it to your advantage.