This is part 4 of the study, “Applying Mean Reversion strategies in India”. In this post we will look at the importance of 200 DMA.
You would want to check out Part 1 , Part 2 and Part 3 of the study if you haven’t already done so.
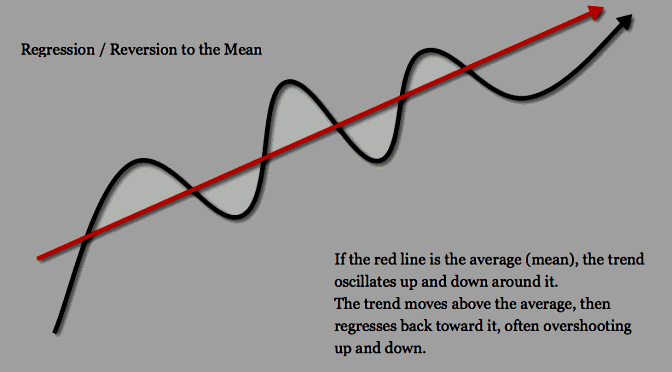
Why 200 DMA is important?
It is a well known fact that trading in the direction of the long term trend improves trading performance. It shows the general wave of the prices & it is easier & profitable to swim in the direction of the tide.
There are multiple ways to define a long term trend of the market or the stock but for our systems, 200 DMA works like a line in sand.
What makes the 200 DMA important is the fact that Big FIIs, Institutions, HNIs & Media are closely watching it which makes it even more important.
Legendary trader Paul Tudor Jones describes 200 DMA as the most important metric in Tony Robbins book Money – Master The Game.
But the lesser known fact is the damage that is caused by the stocks which goes below this average. We can avoid these wreckages by trading stocks only above this average.
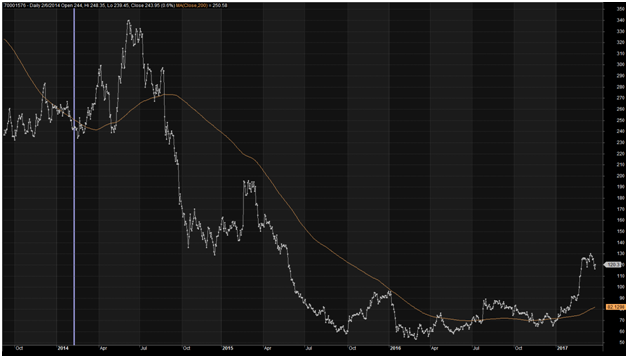
We will see couple of examples of what happens when a stock goes below it’s 200 DMA.
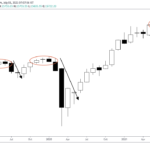
Jindal Steel & Power
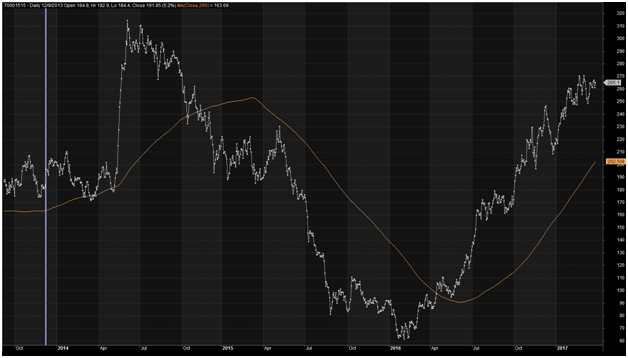
Vedanta
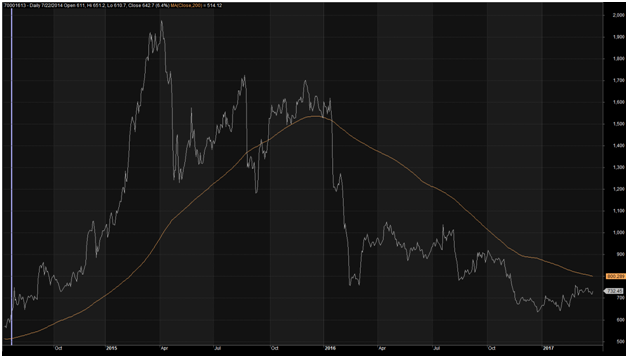
WockPhrma
DivisLabs
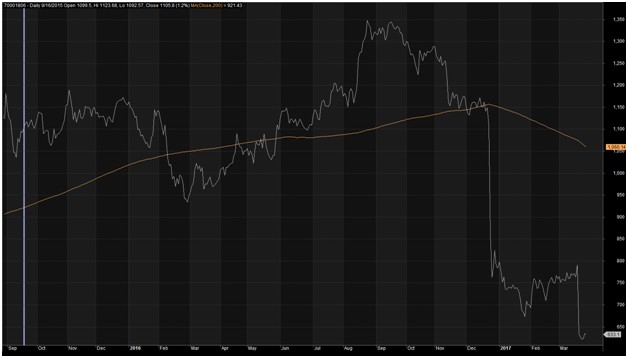
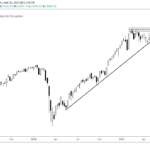
We can see from the above charts the importance of 200 DMA (Orange Line). More importantly, notice the damage done to the stock once it moves below 200 DMA.
These are only handful examples. Check out the charts from the year 2008-2009, what happened to the stocks below 200 DMA. This simple average could save us lot of pain and money.
By now you must be wondering why the charts are so old. Well, originally I conducted this study in 2017. But you can check out the charts of ADAG group, DHFL, PC Jewellers, Tata motors etc. You will see that 200 DMA has stood the test of time.
We will also see the test results for both buying as well as shorting below 200 DMA using above strategies. All the rules will be the same as above strategies except for Rule no. 2 which requires stock to be above 200 DMA. We use same strategies but when the stock is trading below 200 DMA.
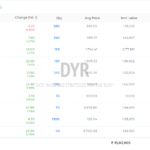
RSI2 results when the stock is below 200 DMA.
| Name | # Trades | Avg % Profit/Loss | CAR | Max. Sys % Drawdown | CAR/MDD |
| RSI2 | 3225 | 0.23 | 11.56 | -42.21 | 0.27 |
| RSI2 | 4422 | 0.22 | 14.58 | -43.05 | 0.34 |
| RSI2 | 3881 | 0.2 | 11.93 | -47.3 | 0.25 |
| RSI2 | 2738 | 0.14 | 4.98 | -51.49 | 0.1 |
| RSI2 | 4185 | 0.12 | 7.95 | -55.8 | 0.14 |
| RSI2 | 1634 | 0.11 | 0.3 | -53.08 | 0.01 |
| RSI2 | 3139 | 0.11 | 3.12 | -61.37 | 0.05 |
| RSI2 | 3537 | 0.1 | 3.61 | -63.75 | 0.06 |
| RSI2 | 1983 | 0.09 | 0.86 | -57.42 | 0.02 |
| RSI2 | 2616 | 0.09 | 0.52 | -74.59 | 0.01 |
| RSI2 | 3821 | 0.08 | 2.82 | -62.27 | 0.05 |
| RSI2 | 2182 | 0.07 | -0.65 | -66.22 | -0.01 |
| RSI2 | 3312 | 0.06 | 1.1 | -74.8 | 0.01 |
| RSI2 | 2488 | 0.06 | -0.66 | -73.35 | -0.01 |
| RSI2 | 2809 | 0.05 | -0.46 | -74.64 | -0.01 |
| RSI2 | 2325 | 0.05 | -0.14 | -63.58 | 0 |
| RSI2 | 3574 | 0.04 | -0.51 | -77.83 | -0.01 |
| RSI2 | 2024 | 0.04 | -1.16 | -66.88 | -0.02 |
| RSI2 | 2062 | 0.02 | -2.29 | -81.06 | -0.03 |
| RSI2 | 3358 | 0.02 | -1.12 | -79.23 | -0.01 |
| RSI2 | 2283 | 0.02 | -2.13 | -76.36 | -0.03 |
| RSI2 | 2648 | 0 | -1.67 | -73.3 | -0.02 |
| RSI2 | 2001 | 0 | -2.09 | -62.77 | -0.03 |
| RSI2 | 1301 | -0.02 | -3.77 | -68.07 | -0.06 |
| RSI2 | 1818 | -0.03 | -3.95 | -78.2 | -0.05 |
| RSI2 | 2584 | -0.03 | -4.41 | -81.22 | -0.05 |
| RSI2 | 2944 | -0.03 | -4.4 | -80.54 | -0.05 |
| RSI2 | 1660 | -0.06 | -3.47 | -67.47 | -0.05 |
| RSI2 | 1960 | -0.1 | -5.58 | -80.7 | -0.07 |
| RSI2 | 1544 | -0.1 | -4.75 | -72.42 | -0.07 |
We can see from the table that there is no edge in buying the stock below 200 DMA. Infact it increases the risk in terms of drawdowns. Drawdown ranges from -42% to a whopping -81.22%. Let’s also check out Cumulative RSI test results.
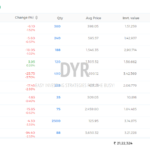
CumRSI results when the stock is below 200 DMA.
| Name | # Trades | Avg % Profit/Loss | CAR | Max. Sys % Drawdown | CAR/MDD |
| CumRSI | 3163 | 0.23 | 12.7 | -41.52 | 0.31 |
| CumRSI | 3495 | 0.21 | 11.48 | -37.78 | 0.3 |
| CumRSI | 2912 | 0.19 | 7.05 | -54.13 | 0.13 |
| CumRSI | 1828 | 0.12 | 4.36 | -41.29 | 0.11 |
| CumRSI | 2923 | 0.12 | 4.14 | -66.2 | 0.06 |
| CumRSI | 2085 | 0.08 | 4.05 | -46.05 | 0.09 |
| CumRSI | 2674 | 0.11 | 3.6 | -44.49 | 0.08 |
| CumRSI | 1070 | 0.09 | 3.42 | -54.63 | 0.06 |
| CumRSI | 1362 | 0.03 | 2.49 | -54.76 | 0.05 |
| CumRSI | 2618 | 0.1 | 2.35 | -64.69 | 0.04 |
| CumRSI | 2646 | 0.09 | 2.24 | -64.32 | 0.03 |
| CumRSI | 1235 | 0 | 1.53 | -52.14 | 0.03 |
| CumRSI | 2308 | 0.08 | 1.22 | -67.27 | 0.02 |
| CumRSI | 1223 | -0.02 | 1.06 | -56.26 | 0.02 |
| CumRSI | 2304 | 0.08 | 0.97 | -61.62 | 0.02 |
| CumRSI | 1832 | 0.03 | 0.68 | -62.48 | 0.01 |
| CumRSI | 898 | 0.07 | 0.22 | -63.98 | 0 |
| CumRSI | 1235 | 0.12 | 0.2 | -62.09 | 0 |
| CumRSI | 2331 | 0.09 | 0.06 | -78.85 | 0 |
| CumRSI | 1724 | 0.11 | -0.24 | -67.1 | 0 |
| CumRSI | 1440 | -0.02 | -0.59 | -61.32 | -0.01 |
| CumRSI | 1539 | -0.04 | -0.6 | -59.21 | -0.01 |
| CumRSI | 2120 | 0.05 | -0.78 | -73.02 | -0.01 |
| CumRSI | 1709 | 0.04 | -0.8 | -74.84 | -0.01 |
| CumRSI | 1016 | -0.16 | -1.74 | -68.01 | -0.03 |
| CumRSI | 1912 | 0 | -2.03 | -71.41 | -0.03 |
| CumRSI | 2133 | -0.01 | -2.69 | -79.87 | -0.03 |
| CumRSI | 1469 | -0.09 | -5.06 | -72.36 | -0.07 |
| CumRSI | 1759 | -0.12 | -5.5 | -76.91 | -0.07 |
| CumRSI | 1585 | -0.19 | -6.98 | -80.84 | -0.09 |
| CumRSI | 1938 | -0.21 | -8.15 | -86.44 | -0.09 |
Cumulative RSI also performs poorly when buying the stocks below 200 DMA. This proves Larry Connors rule that buying stocks above 200 DMA improves the results. Also it saves us from extremely large drawdowns.
Does short selling work below 200 DMA?
If buying below 200 DMA does not work then selling below 200 DMA should work when the indicators are overbought? Let’s check it out.
Rules:
- Close of the stock is above Rs.5 and average daily volume over last 21 days greater than 500000 shares.
- The closing price of the stock must be below 200 Day Moving Average.
- Today Short on the close if RSI (2) is greater than 85,90,95,99.
- If today Exit is triggered, we cover the positions on next day’s open :
- Exits Used: First Down close, Close less than 3 Day Moving Average, Close less than 5 Day Moving Average, RSI (2) less than 30, 50, and 70.
- Maximum 5 open positions.
Let’s see the test results on the short side for RSI (2) strategy.
| Name | # Trades | Avg % Profit/Loss | CAR | Max. Sys % Drawdown | CAR/MDD |
| RSI2 | 4098 | -0.41 | -24.47 | -97.97 | -0.25 |
| RSI2 | 3620 | -0.45 | -24.06 | -97.57 | -0.25 |
| RSI2 | 2708 | -0.54 | -21.89 | -96.58 | -0.23 |
| RSI2 | 1005 | -0.58 | -9.9 | -77.77 | -0.13 |
| RSI2 | 2513 | -0.58 | -22.67 | -96.83 | -0.23 |
| RSI2 | 780 | -0.5 | -7.83 | -77.19 | -0.1 |
| RSI2 | 1777 | -0.4 | -13.49 | -88.73 | -0.15 |
| RSI2 | 2243 | -0.55 | -20.89 | -96.7 | -0.22 |
| RSI2 | 2466 | -0.61 | -24.23 | -98.07 | -0.25 |
Well, we can see that on the short side, all the variations are negative. Why is that??
Why the strategy doesn’t work on the short side?
1. Non-existent Cash stocks lending & borrowing.
Unlike in the US, we can’t short sell cash stocks. We can only short handful of stocks available in derivatives. This limits people from going short on stocks. Also people are usually long biased. People like to buy first and sell later rather than the other way round. Although exchanges have started Securities lending & borrowing mechanism but the liquidity is yet to pick up.
2. Long Term Bullish Bias:
Another important reason is the long term bullish bias on Indian markets. Despite many large drawdowns, markets have shown upward bias over a period of time.
Conclusion:
As we can see from the above tests how much it is important to be positioned in the direction of the long term trend as indicated by 200 DMA. This simple average can save us a lot of money & pain.
We also saw that mean reversion strategies don’t work on the short side. This came as surprise to me but that’s the case.
On side note, I have tested so many variations & strategies but none of them provided any satisfactory results except for one strategy. This short strategy has been consistent winner & is having a great 2019. I will share details about the strategy in future posts.
In the next post, we will see how these strategies perform when Stop Losses are applied.