One of the most versatile & robust indicators is the RSI or Relative Strength Index Indicator. RSI Indicator was developed by J Welles Wilder in the late 70s and published in his book, New Concepts in Technical Trading Systems.
Not just the RSI Indicator but he published a few more indicators like ADX and ATR which I still use on a daily basis.
RSI Indicator has become one of the most popular indicators of all time and most charting software have it built-in.
So what’s the RSI Indicator and How do you calculate it?
The following is how the RSI Indicator is calculated…
RSI formula…
RSI = 100 – 100/ 1 + RS.
Where RS = Average Gain / Average Loss.
It’s important to note here that the losses are expressed as positive values.
The RSI calculation is divided into 3 parts…
1. Average gains and losses are simply 14-day averages of the gains & losses.
- First Average Gain = Total of gains over the past 14 days / 14.
- First Average Loss = Total of Losses over the past 14 Days / 14.
It is important to note here that the average gains and losses are not true averages. Instead of dividing by the number of gaining (losing) periods, total gains (losses) are always divided by the specified number of periods – 14 in this case.
What it means is, say, the stock has risen on 7 days out of 14 days, the true average gain should be total gains divided by 7 days, right? But here what we are doing is dividing it by the total period which is 14 days. Why? Because we are looking for the magnitude of the gains in comparison to losses during the last 14 days.
2. The next step is to calculate running average gains as shown below…
- Average Gain = [(previous Average Gain) x 13 + current Gain] / 14.
- Average Loss = [(previous Average Loss) x 13 + current Loss] / 14.
3. RS = Average Gains / Average losses and plug in the values in the RSI formula.
Let’s conceptually try to understand what RSI is. RSI is a banded indicator which means that the RSI values can’t be negative or be more than 100. The RSI Indicator is generally used as an overbought/oversold indicator and the default period is set to 14 days.
RSI compares the magnitude of the stock’s gains to the magnitude of its losses over the last 14 days. Generally, RSI levels over 70 are considered overbought & levels below 30 are considered oversold.
Now if the stock has an RSI over 70, it simply means that the stock has risen more than it has fallen. Thus it shows the strength or the momentum of the stock as its original name suggests.
But most people still use it as only a mean reversion indicator rather than an indicator to identify the momentum!
I have found RSI to be a great indicator to identify strong stocks. we’ll get into that a little bit later!
But for now, let’s see whether traditional use of RSI provides any value.
Does the traditional 14 period RSI work?
To do that we’ll run a simple backtest between 31/12/2006 to date on NSE 500 stocks.
Rules:
1. Buy the 10 most oversold stocks whose 14, 7, 4, 2 periods RSI is less than 30.
2. Exit when the RSI crosses above 70.
Simple right?
Check out the below chart…
What we are trying to find out is whether the traditional 14 period RSI has any edge and how it behaves when the look-back period is reduced.
We’re not looking for a specific system but the general behavior of the RSI.
Let’s check out the results!
Lo & behold!
14 period RSI doesn’t seem to work!
This might be a surprise to you but 14 periods RSI doesn’t have any edge!
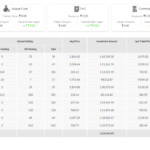
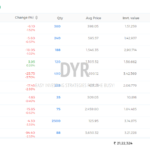
Go check out the table!
RSI 14 has generated a CAGR of just 3.76% over the last 13 and a half years!
Buying oversold stocks based on RSI 14 doesn’t work!
But all is not lost…
RSI performance begins to improve once we reduce the look-back periods from default 14 days.
Why?
Any guesses?
Because stocks are mean-reverting in the short-term while trending in medium to long term!
Shorter period RSIs do a better job of identifying oversold conditions.
This behavior has been proven by Larry Connors long ago in his book, ‘Short term trading strategies that work’.
The Expectancy of RSI Indicator:
Now, for any system to be profitable, you need the following 3 variables in place…
- Avg win/loss ratio
- Probability of winning
- The number of opportunities!
A trend-following system typically has fewer winners, fewer opportunities but a huge win/loss ratio!
Why?
Because the trades are held for the long term.
While a typical mean reversion system has a large number of opportunities, higher winning % but lower avg win/loss ratio because the trade duration is very short!
Now, for the system to be viable, a reduction in any of the above three components must be compensated by the other two!
But traditional 14 period RSI tells you a different story…
14 period RSI trades are held for over 105 days on average and yet, the average gain is just 3%.
So the conclusion is, if you’re using RSI to filter out oversold stocks, shorter periods like 2, 3, 4 does a much better job than conventional RSI 14.
How to use RSI Indicator correctly?
We learned at the beginning of the guide that the RSI Indicator is not only robust but also versatile!
When something doesn’t work, It’s always a good idea to turn it upside down & see if that works!
What if we did the opposite & bought the most overbought stocks based on RSI?
It sounds like a terrible idea!
or is it?
Let’s find out!
Rules:
1. Buy the top 10 most overbought stocks whose 14, 7, 4, 2 periods RSI is greater than 70.
2. Exit when the RSI crosses below 30.
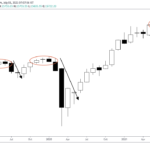
Check out below chart to understand the rules…
We can see in the chart above that buying the stock when it became overbought has turned out to be highly profitable compared to buying when it was oversold!
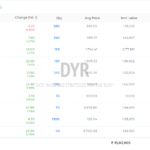
Let’s see what the test results show…
We inverted the rules & the results are also inverted…
We see that the shorter period RSI underperforms while the longer-term RSI excels…
As I mentioned earlier that in the short-term, stocks are mean-reverting while over the long term stocks show trending characteristics.
In the short-term, overbought stocks show negative returns because of mean reversion.
But what about our beloved 14 period RSI?
RSI 14 shatters all the notions that you shouldn’t buy overbought stocks! if you look at the results, Buying overbought stocks based on RSI 14 does exceedingly well!
Why?
- Because the stocks can remain overbought for a long period of time.
- More often than not, overbought stocks indicate the start of a new trend.
- RSI above 70 shows that the stock has risen more than it has fallen over the period which shows that the stock has strong momentum. And what we know about momentum? It’s simply the price persistence! In other words, strong stocks will remain strong for a period of time!
Is it a fluke that buying overbought stocks works better than the oversold stocks based on the RSI 14?
I don’t think so.
Why?
Because winners outperform losers. Period!
And overbought stocks just show that they are winners!
I have found RSI to be an excellent indicator in my long term momentum strategy instead of generic ROC or Rate of Change Indicator.
What if we combine the long term RSI with the short term RSI?
We saw that the traditional RSI can be very effective in pinpointing the start of a new trend in stocks while the shorter period RSI does a great job of identifying short-term extremes.
But the real magic happens when we combine the both!
What if we use 14 periods RSI for trend following or momentum trading while 2 period RSI for mean reversion.
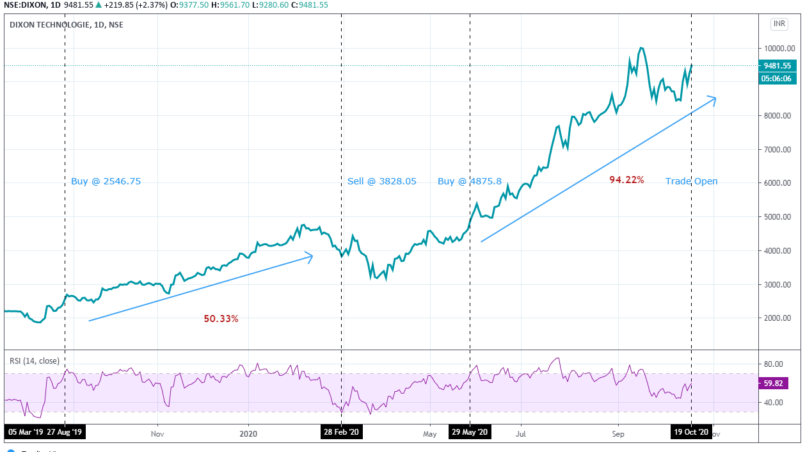
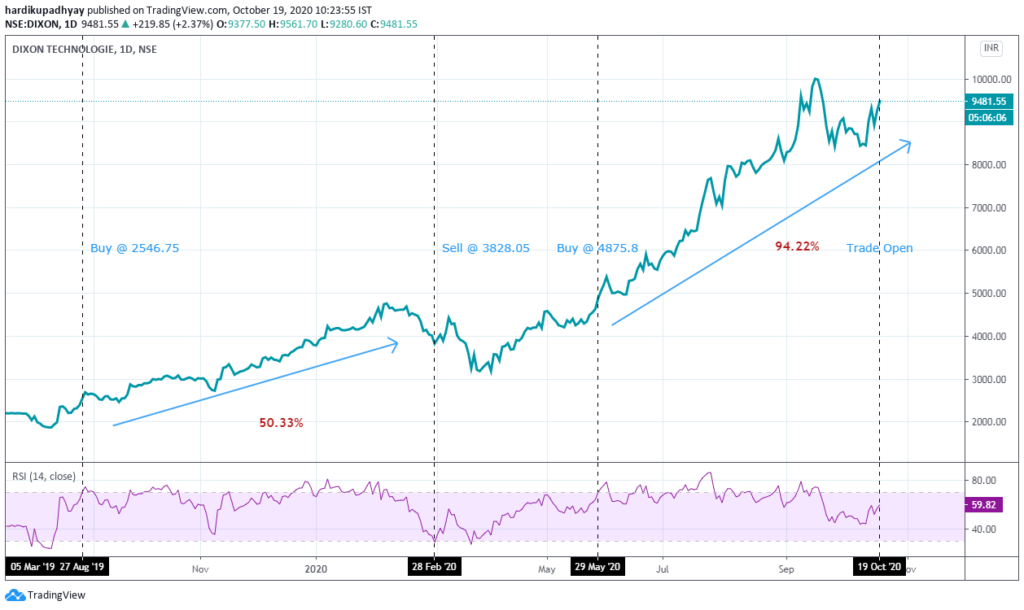
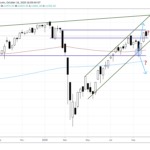
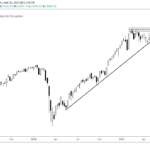
Let’s check out the example of what I mean…
As you can see that, had we bought the stock when its 14 periods RSI went up above 70 and held on until now, we would have been on an open profit of over 94%.
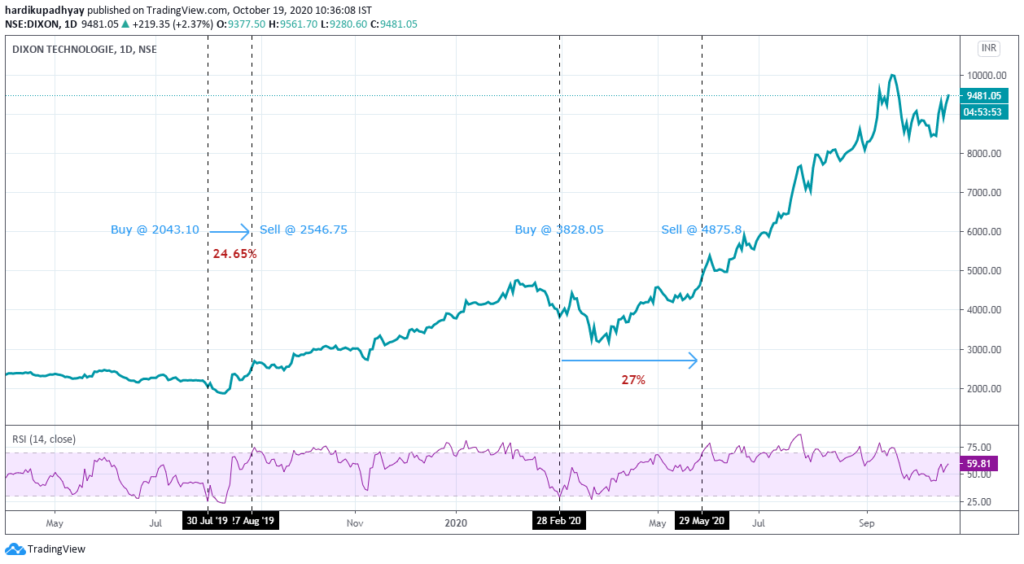
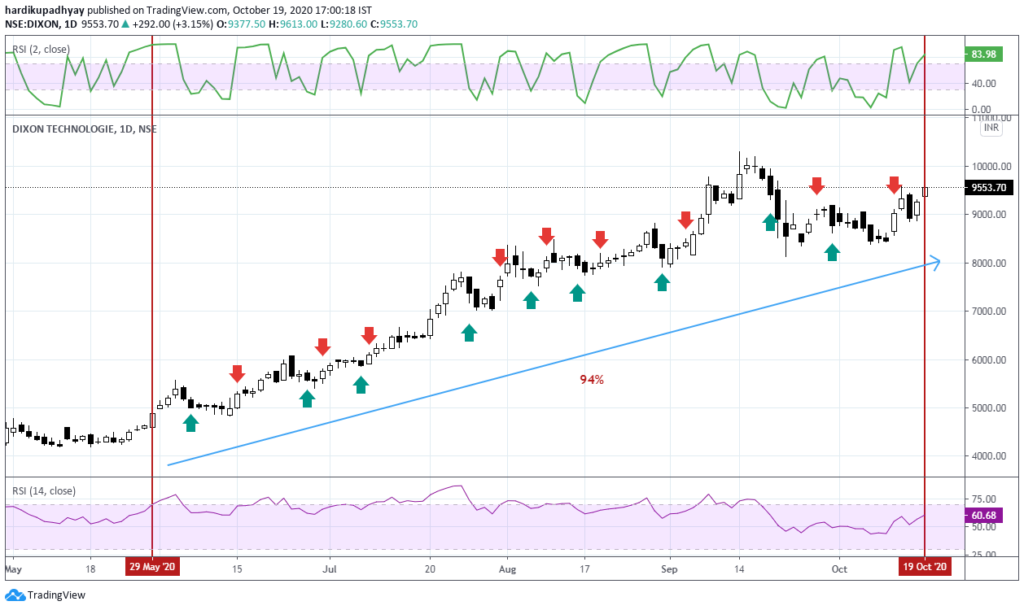
On top of it, had we also taken advantage of the short-term pullbacks in stock when the 2 periods RSI dropped below 30 and sold when it rose above 70, we would have made approximately 28% over and above the 94% by holding the stock.
Now, this is not an exact system!
Far from it!
This example is just to illustrate how combining both the momentum & mean reversion characteristics of stock would have been highly profitable.
I would like to call this concept a Hybrid Approach where you combine multiple mildly correlated trading systems based on momentum & mean reversion to improve your returns with reduced risk.
I hope you have got the idea!
Summary:
As we saw that the RSI is one of the best indicators out there which can work for both trend following or mean reversion.
- RSI is a robust & versatile indicator.
- Longer period RSIs works very well for trend following or momentum type strategies.
- Shorter period RSIs work very well for swing trading or mean reversion type of trading.
- Combining both the long term RSI & short-term RSI can create the magic which I call the Hybrid Approach. To learn more about the Hybrid Approach, you can download Free E-book, “Double Your Investment Returns!”
- Doing something opposite of what most people are doing is the way to lasting success! Buying overbought stocks is one such thing!
- I have written a handful of articles on RSI in particular & Mean reversion in general. Do check it out here.
*** Survivorship bias exists. No brokerage included in the tests. Past performance is no guarantee of future returns! This is not an investment advice & it is only for educational & informational purposes.


Very well explained!
Same tool can give varying results. Education is how to use a tool. Wisdom is how to use it for maximum utility.
Well said Pravin!
Great one Hardik. Need to scan all ur write-ups on this website, to-do list for the weekend.
Thank you.