This is part 5 of the study, “Applying Mean Reversion strategies in India”. Larry Connors in his book, “Short Term Trading Strategies that Work”, shocked the hell out of the trading world when he declared that stop-loss doesn’t work. At least as far as mean reversion trading strategies are concerned. In this post, we will try to see whether stop-losses are beneficial.
You would want to check out Part 1, Part 2, Part 3 and Part 4 of the study if you haven’t already done so.
But I agree with him. I have seen so many times that the stock hits my stop-loss & rises right back up beyond my purchase price. This has happened so many times with me.
I had mentioned this in my earlier post, “Why I trade Mean Reversion trading strategies?” I had my colleague who used to buy frontline stocks when they had corrected a lot. But he never used to keep any kind of stop-loss. I used to think he was crazy not to keep any kind of stop-loss. But more often than not, he would turn out to be a winner.
So do stop-losses really don’t work?
You may have noticed that I have not used any stop-loss in earlier tests. Before we understand whether stop-losses work or not let’s understand why do we use stop-loss in the first place?
Well, we use stop loss obviously to reduce the overnight risk and reduce the drawdowns. But we will see in the following tests that stop losses hurt the performance of mean reversion strategies we saw in earlier posts.
For this test purposes, we will use top variations with the highest average gain per trade from both the strategies, RSI2 & CumulativeRSI and apply different percentages of maximum stop losses.
RSI2 Strategy Variation with Stop-Loss: RSI2 < 2 and C > MA (5):
| Stops % | # Trades | Avg % Profit/Loss | CAR | % of Winners | % of Losers | Max. Sys % Drawdown |
| None | 1507 | 1.34 | 29.1 | 71.27 | 28.73 | -26.19 |
| 1 | 3123 | 0.12 | 7.15 | 23.47 | 76.53 | -28.35 |
| 3 | 2390 | 0.13 | 4.85 | 42.38 | 57.62 | -40.82 |
| 5 | 2028 | 0.39 | 12.65 | 55.72 | 44.28 | -26.85 |
| 7 | 1842 | 0.67 | 19.6 | 63.14 | 36.86 | -27.1 |
| 10 | 1697 | 0.85 | 22.42 | 67.77 | 32.23 | -24.6 |
| 15 | 1614 | 1.04 | 24.95 | 70.63 | 29.37 | -23.94 |
| 20 | 1557 | 1.18 | 26.96 | 70.46 | 29.54 | -24.21 |
| 25 | 1540 | 1.19 | 27.23 | 70.52 | 29.48 | -25.27 |
| 30 | 1527 | 1.27 | 28 | 70.6 | 29.4 | -27.87 |
| 35 | 1527 | 1.31 | 28.8 | 70.92 | 29.08 | -27.38 |
| 40 | 1520 | 1.29 | 27.77 | 70.99 | 29.01 | -31.15 |
| 50 | 1514 | 1.31 | 28.4 | 71 | 29 | -28.84 |
CumRSI Strategy Variation with Stop Loss: CumRSI < 2 and RSI2 >70.
| Stops % | # Trades | Avg % Profit/Loss | CAR | % of Winners | % of Losers | Max. Sys % Drawdown |
| None | 637 | 2.01 | 19.63 | 71.43 | 28.57 | -20.31 |
| 1 | 1144 | 0.3 | 6 | 21.42 | 78.58 | -20.11 |
| 3 | 953 | 0.56 | 8.74 | 39.98 | 60.02 | -20.4 |
| 5 | 834 | 0.81 | 10.62 | 52.88 | 47.12 | -20.59 |
| 7 | 779 | 0.84 | 10.19 | 59.44 | 40.56 | -22.69 |
| 10 | 717 | 1.01 | 11.79 | 64.57 | 35.43 | -24.57 |
| 15 | 677 | 1.35 | 13.91 | 68.83 | 31.17 | -24.6 |
| 20 | 659 | 1.62 | 16.7 | 70.26 | 29.74 | -25.43 |
| 25 | 652 | 1.76 | 17.36 | 70.55 | 29.45 | -28.15 |
| 30 | 643 | 1.9 | 18.6 | 70.61 | 29.39 | -26.04 |
| 35 | 641 | 1.93 | 18.32 | 70.83 | 29.17 | -27.01 |
| 40 | 640 | 1.99 | 19.15 | 71.09 | 28.91 | -26.14 |
| 50 | 640 | 1.96 | 19.06 | 70.94 | 29.06 | -28.12 |
As we can see from the above tests, stop-losses do hurt the performance of the strategies. It is a costly form of insurance which is not helping in overnight gaps as well as not helping reduce the overall drawdown of the system.
If we look closely, the drawdown remains more or less similar to the original strategy without stop-loss.
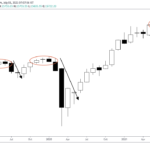
For example, you bought a stock at Rs. 100 with a stop-loss at 90. What if after the market close some bad news hits the stock and the next day it opens more than 20% lower!!! Your stop-loss will not help you here.
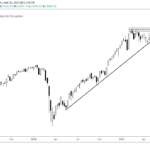
Also, it goes against the very premise of the strategies which look to buy weakness. As we have seen from earlier tests, the more the stock is oversold, the more likely, it will snap back.
Once in a while, you will get this big loss on any particular stock but our objective must be that it should not damage the overall portfolio. Keeping stop-losses reduces the overall performance of the strategy because along with some big losing trades, it also eliminates many potentially profitable trades.
So what do we do if stop-losses can’t protect us?
If we don’t keep stop-losses, how do we manage the risk? Well, you can reduce the risk by taking multiple positions in your portfolio.
For Example, you invest only 10 % of the value to any particular position. Now, unfortunately, if any individual position goes down by say 25 %, that will be just 2.5 % of the overall portfolio.
Also, it is beneficial to have a portfolio level stop-loss. Depending upon your risk appetite, you can have a portfolio stop-loss at say, 20 %. Once your portfolio value decreases by more than 20 %, you can choose to stop trading or reduce position size. This is better than keeping stop-losses on individual trades.
I do not use stop-losses on my live trading strategies. But I use dynamic position sizing & portfolio level stop-loss.
In the next post, we will conclude our study & discuss some of the limitations of these tests.